A
B
C
D
Text Solution
Verified by Experts
The correct Answer is:


Similar Questions
Explore conceptually related problems
Recommended Questions
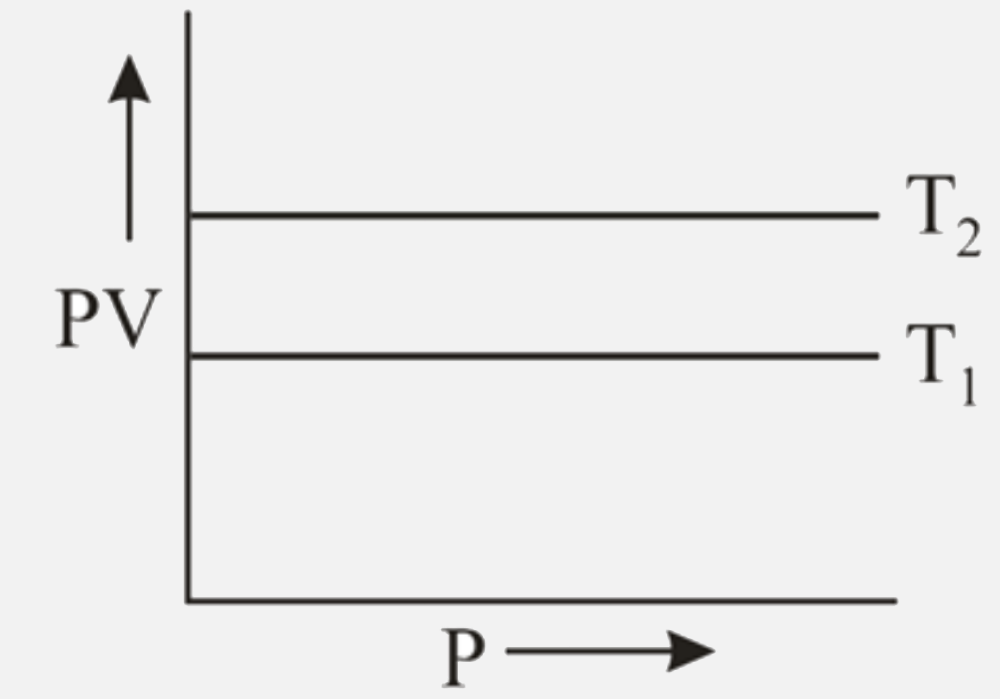
- The product (PV) is plotted against P at two temperature T1 and T2 and...
Text Solution
|
- The current - voltage graphs for a given metallic wire at two differen...
Text Solution
|
- The current in a metallic conductor is plotted against voltage at two ...
Text Solution
|
- The V - I graphs for a conductor at temperature T1 and T2 are shown in...
Text Solution
|
- for the given PV isotherms , which of the following is correct for T1 ...
Text Solution
|
- The product (PV) is plotted against P at two temperature T1 and T2 and...
Text Solution
|
- Which inferences have been accurately drawn from the given plot? (Temp...
Text Solution
|
- V-I graph for a mettalic wire at two different temperatures T1 and T2 ...
Text Solution
|
- Two different temperatures of an ideal gas T1 Oh T2 Pressure (P) vs. T...
Text Solution
|