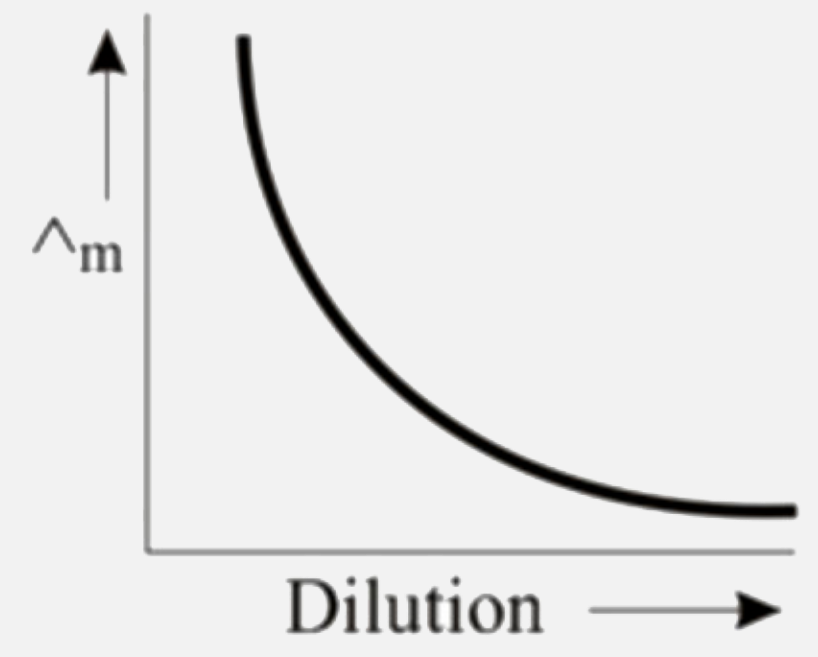
A
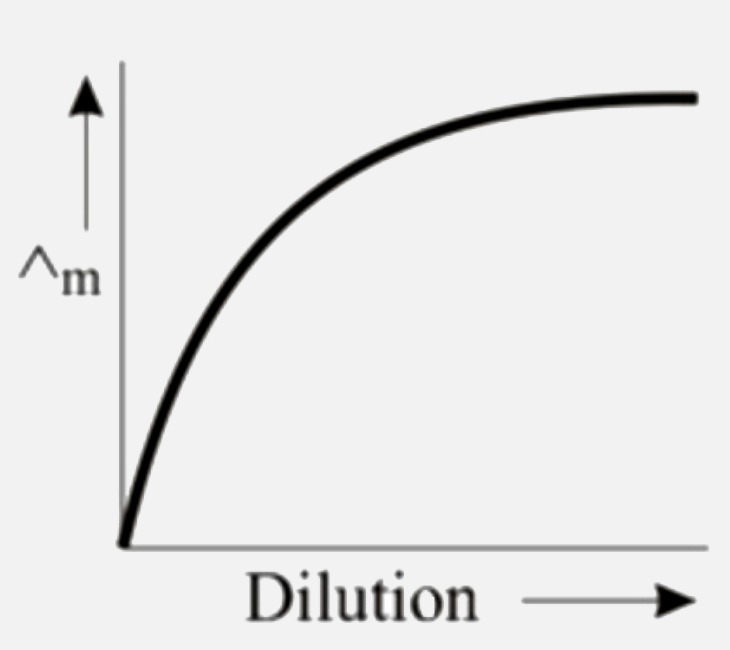
B
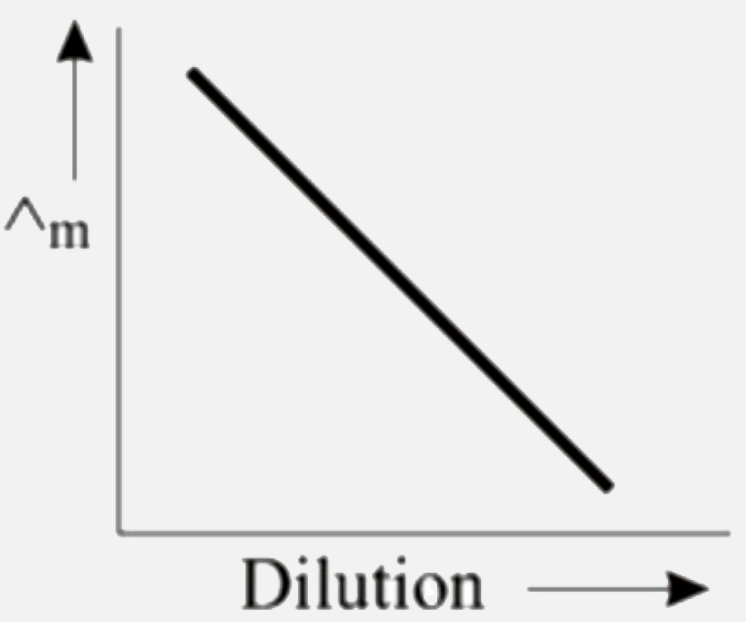
C
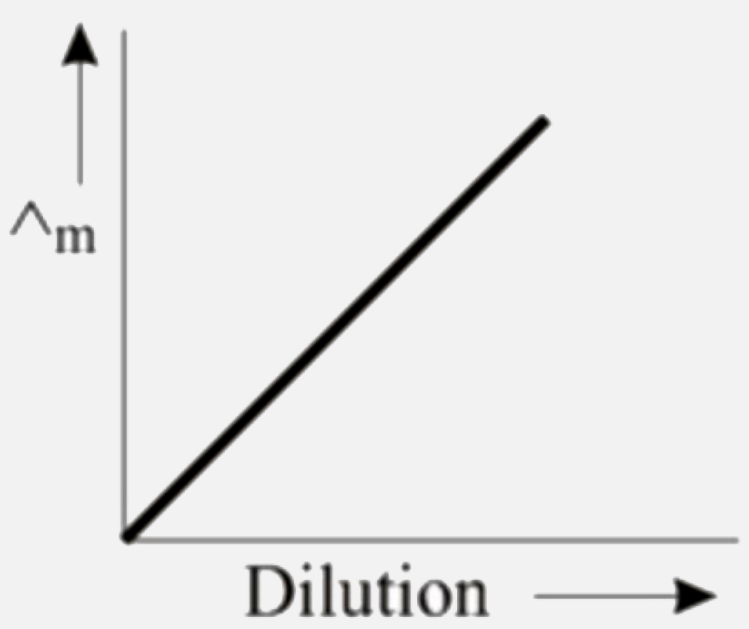
D
Text Solution
AI Generated Solution
The correct Answer is:


Similar Questions
Explore conceptually related problems
Recommended Questions
- Which of the following graph correctly represents the variation of mol...
Text Solution
|
- For a dilute solution of a strong electrolyte, the variation of molar ...
Text Solution
|
- Which of the following plots represents correctly the variation of mol...
Text Solution
|
- Explain with a graph the variation of molar conductivity of a strong e...
Text Solution
|
- Which of the following plots represents correctly variation of equival...
Text Solution
|
- Which of the following graph correctly represents the variation of mol...
Text Solution
|
- Explain with a graph the variation of molar conductivity of a strong e...
Text Solution
|
- Which of the following plots correctly represents variation of equival...
Text Solution
|
- Variation OF molar conductivity with dilution|| Strong electrolyte|| W...
Text Solution
|