A
B
C
D
Text Solution
Verified by Experts
The correct Answer is:


Similar Questions
Explore conceptually related problems
Recommended Questions
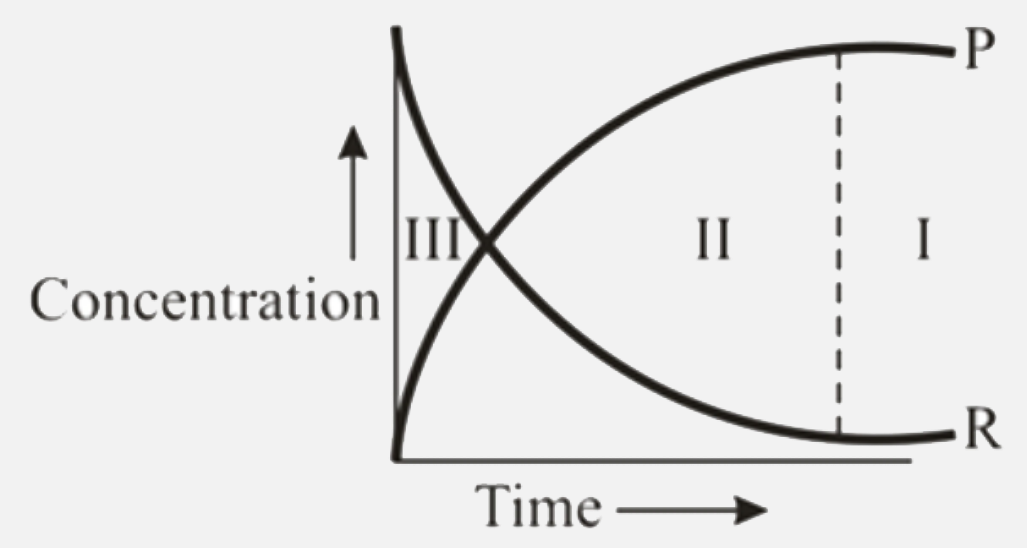
- For the reaction RhArrP Variation of concentration is plotted against ...
Text Solution
|
- In the reaction PCl(5)(g)hArrPCi(3)(g)+Ci(2)(g) a graph in plotted...
Text Solution
|
- The given plots represent the variation of the concentration of a reac...
Text Solution
|
- The given plots represent the variation of the concentration of a reac...
Text Solution
|
- The given plots represent the variation of the concentration of a reac...
Text Solution
|
- For the reaction RhArrP Variation of concentration is plotted against ...
Text Solution
|
- For a chemical reaction R to P, the variation in the concentration (R)...
Text Solution
|
- The given plots represent the variation of the concentration of a reac...
Text Solution
|
- In the reaction of autocatalysis, the variation of concentration with ...
Text Solution
|