A
B
C
D
Text Solution
Verified by Experts
The correct Answer is:


Similar Questions
Explore conceptually related problems
Recommended Questions
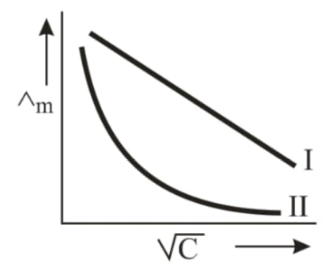
- Above plot represents the variation of molar conductance against sqrtC...
Text Solution
|
- Define conductivity and molar conductivity for the solution of an ele...
Text Solution
|
- Which of the following plots represents correctly the variation of mol...
Text Solution
|
- A graph was plotted between molar conductivity of various electrolytes...
Text Solution
|
- Define conductivity and molar conductivity for the solution of an elec...
Text Solution
|
- Above plot represents the variation of molar conductance against sqrtC...
Text Solution
|
- Define conductivity and molar conductivity for the solution of an elec...
Text Solution
|
- Define conductivity and molar conductivity for the solution of an ele...
Text Solution
|
- Variation of Conductivity and Molar Conductivity with Concentrations
Text Solution
|