To solve the problem of how the conductance changes when HCl (aq) is titrated with NaOH (aq), we can break down the process step by step.
### Step-by-Step Solution:
1. **Understanding the Initial Situation**:
- In the beginning, we have a solution of HCl, which dissociates into H⁺ and Cl⁻ ions. The presence of H⁺ ions contributes significantly to the conductivity of the solution because they are highly mobile and carry charge effectively.
**Hint**: Remember that strong acids like HCl dissociate completely in solution, contributing to high conductivity.
2. **Adding NaOH**:
- As NaOH is added to the HCl solution, it dissociates into Na⁺ and OH⁻ ions. The H⁺ ions from HCl will react with OH⁻ ions from NaOH to form water (H₂O). This neutralization reaction reduces the concentration of H⁺ ions in the solution.
**Hint**: Focus on the neutralization reaction: H⁺ + OH⁻ → H₂O, which decreases the number of H⁺ ions.
3. **Conductivity Changes**:
- Initially, as NaOH is added, the concentration of H⁺ ions decreases, leading to a decrease in conductivity. This is because the H⁺ ions, which have high mobility, are being neutralized.
**Hint**: Conductivity is directly related to the concentration of mobile ions in solution. A decrease in H⁺ means lower conductivity.
4. **Reaching the Equivalence Point**:
- At the equivalence point, all H⁺ ions have reacted with OH⁻ ions. The solution now contains Na⁺ and Cl⁻ ions, and the conductivity is at its lowest point.
**Hint**: The equivalence point is where the amount of titrant (NaOH) added is stoichiometrically equivalent to the amount of analyte (HCl).
5. **Post-Equivalence Point**:
- After the equivalence point, if more NaOH is added, the concentration of OH⁻ ions increases. Since OH⁻ ions also contribute to conductivity, the overall conductivity of the solution starts to increase again.
**Hint**: After neutralization, the increase in OH⁻ ions will lead to an increase in conductivity.
6. **Graphical Representation**:
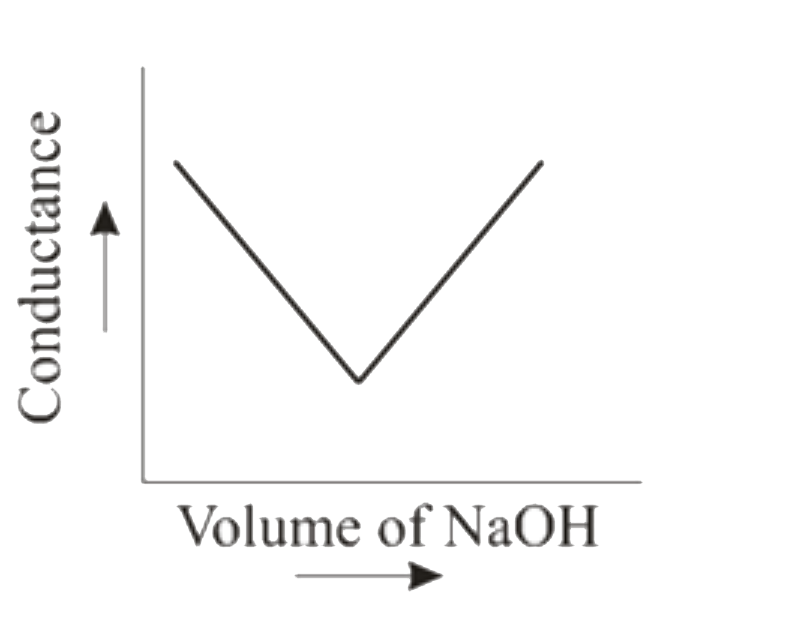
- When plotting conductivity against the volume of NaOH added, the graph will show a decrease in conductivity as H⁺ ions are neutralized, reaching a minimum at the equivalence point, followed by an increase in conductivity as more OH⁻ ions are added.
**Hint**: The graph will have a characteristic 'V' shape: decreasing to a minimum at the equivalence point and then increasing.
### Conclusion:
The correct graphical representation of the titration of HCl with NaOH conductometrically will show a decrease in conductivity until the equivalence point, followed by an increase in conductivity after the equivalence point.
### Final Answer:
The graphical representation of the titration of HCl (aq) with NaOH (aq) conductometrically will show a decrease in conductivity until the equivalence point, followed by an increase in conductivity after the equivalence point.