A
B
C
D
Text Solution
Verified by Experts
The correct Answer is:


Similar Questions
Explore conceptually related problems
Recommended Questions
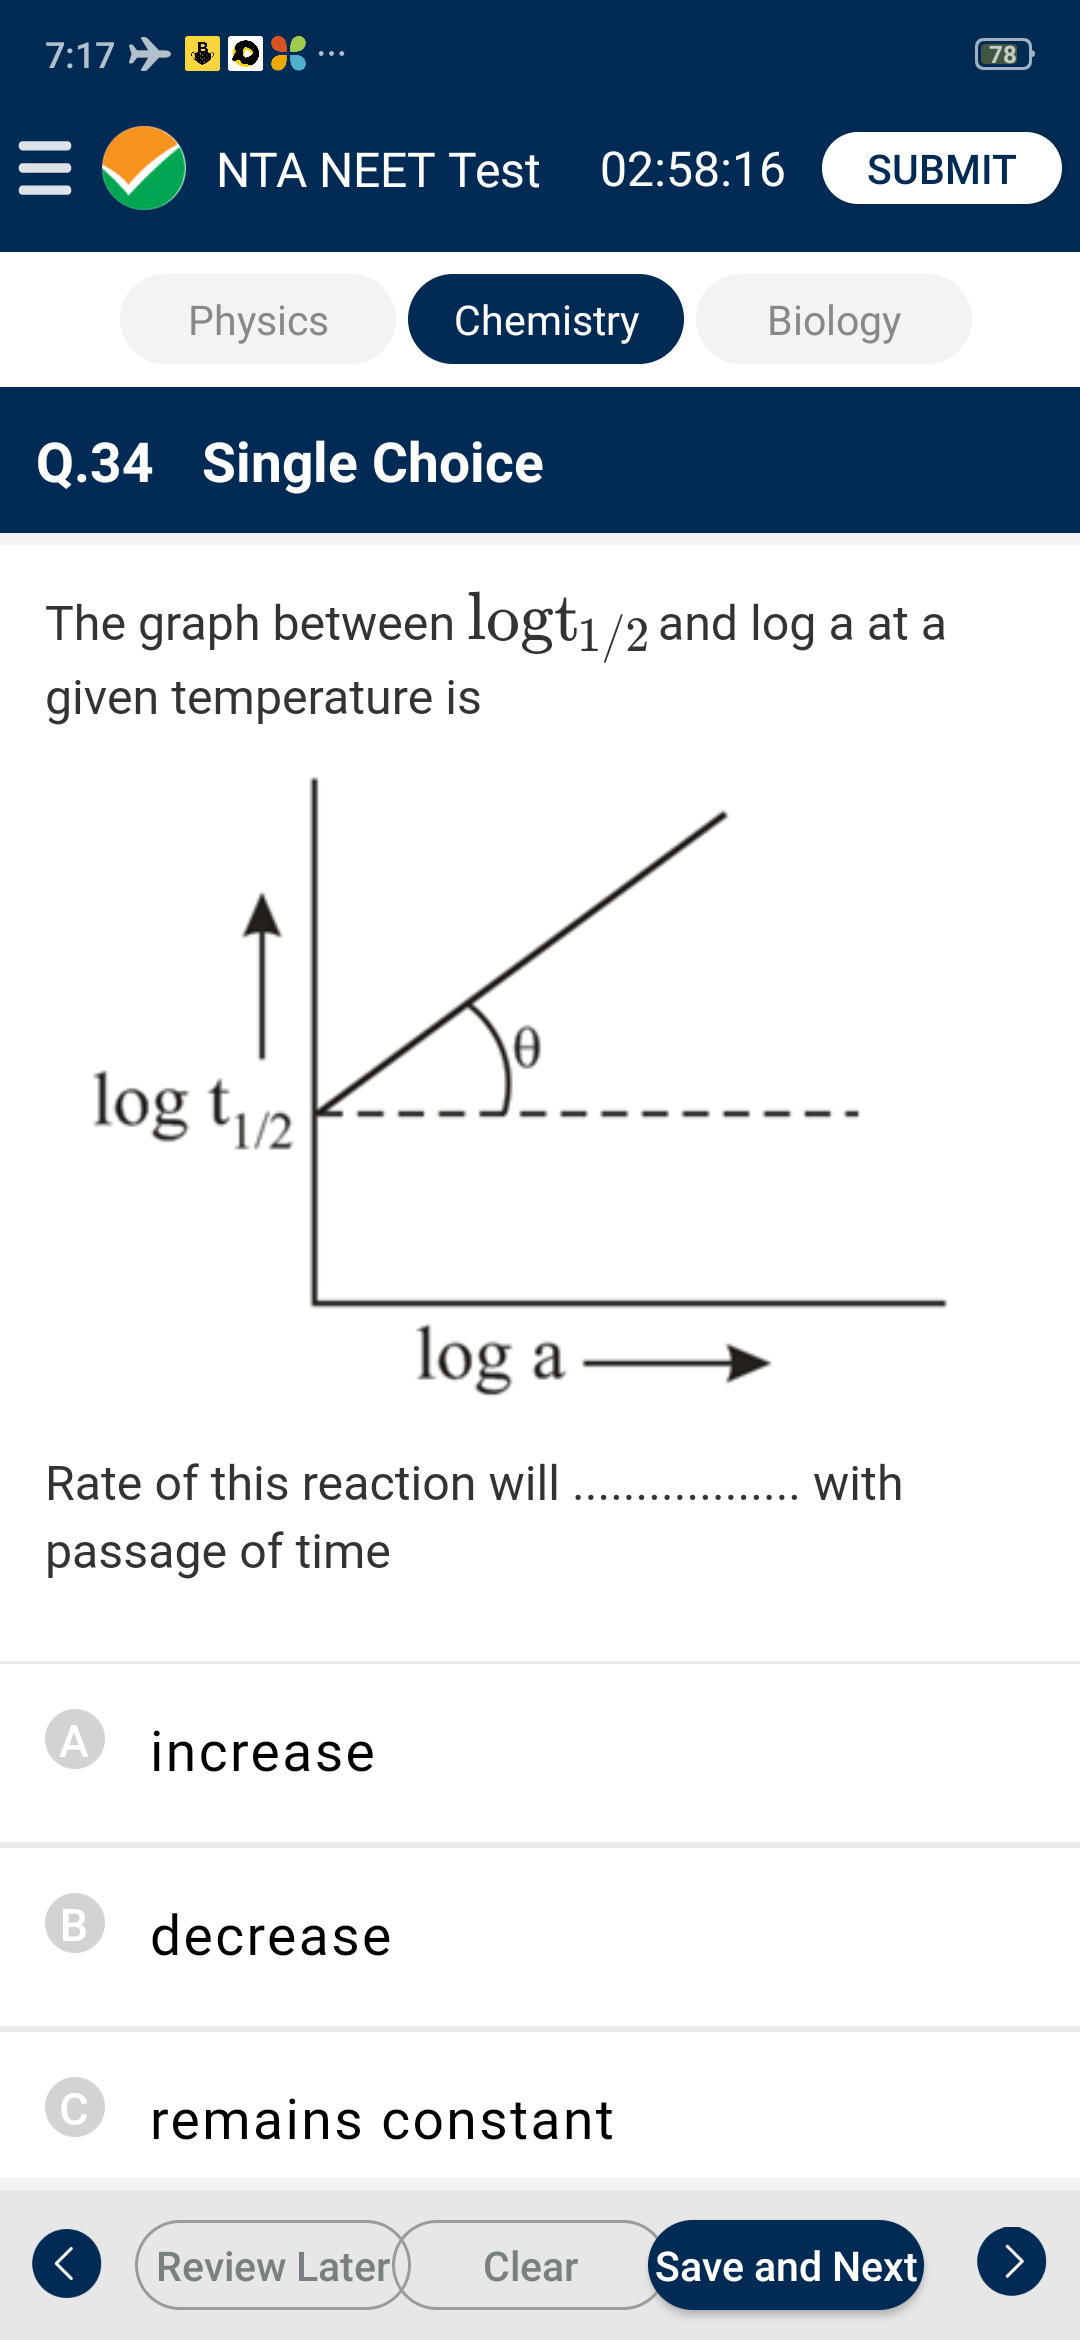
- The graph between log t(1//2) and log a at a given temperature is ...
Text Solution
|
- Following is the graph between log T(50) and log a ( a = initial conce...
Text Solution
|
- Following is the graph between log t(1//2) and log a (a initial concen...
Text Solution
|
- A graph between log t((1)/(2)) and log a (abscissa), a being the initi...
Text Solution
|
- Following is the graph between log T(50) and log a (a = initial concen...
Text Solution
|
- Plotting a graph of log t(1//2) against log [A](0) of a rectant for a ...
Text Solution
|
- What is the type of graph between log P and log ((1)/(V)) at constant ...
Text Solution
|
- The graph between log t(1//2) and log a at a given temperature is ...
Text Solution
|
- A graph between log t((1)/(2)) and log a (abscissa), a being the init...
Text Solution
|