A
B
C
D
Text Solution
Verified by Experts
The correct Answer is:


Similar Questions
Explore conceptually related problems
Recommended Questions
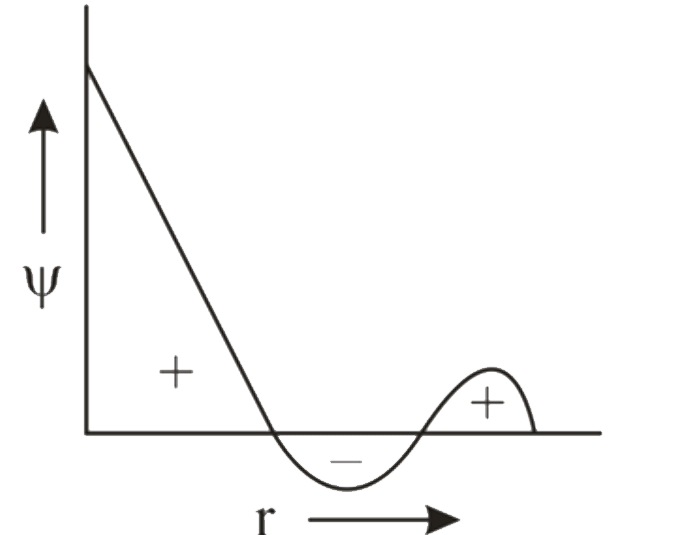
- Wave function of an orbital is plotted against the distance from nucle...
Text Solution
|
- Which orbital has only positive value of wave function at all distance...
Text Solution
|
- Wave function of an orbital is plotted against the distance from nucle...
Text Solution
|
- Which of the following representation of wave functions of molecular o...
Text Solution
|
- Which orbital has only positive value of wave function at all distance...
Text Solution
|
- Explain the Graphical representation of the wave.
Text Solution
|
- Wave Function of Orbital | Graphical Representation & Question Discuss...
Text Solution
|
- Wave function of an orbital is plotted against the distance from nucle...
Text Solution
|
- নীচের কোন অর্বিট্যালের ক্ষেত্রে নিউক্লিয়াস থেকে সকল দূরত্বে প্রাপ্ত তর...
Text Solution
|