To determine which graph shows the most significant deviation from ideal gas behavior, we can analyze each option based on the relationships defined by the ideal gas law, \( PV = nRT \).
### Step-by-Step Solution:
1. **Understanding Ideal Gas Behavior**:
The ideal gas law states that for an ideal gas, the relationship between pressure (P), volume (V), temperature (T), and number of moles (n) is given by the equation \( PV = nRT \). An ideal gas behaves perfectly according to this equation under all conditions.
2. **Analyzing Each Graph**:
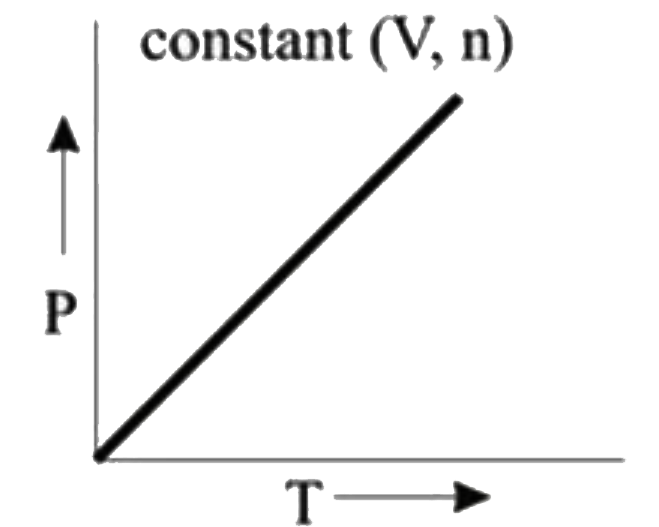
- **Graph 1 (P vs. T)**:
- This graph keeps volume (V) and number of moles (n) constant. According to the ideal gas law, if V and n are constant, P is directly proportional to T. Therefore, this graph will be a straight line, indicating no deviation from ideal behavior.
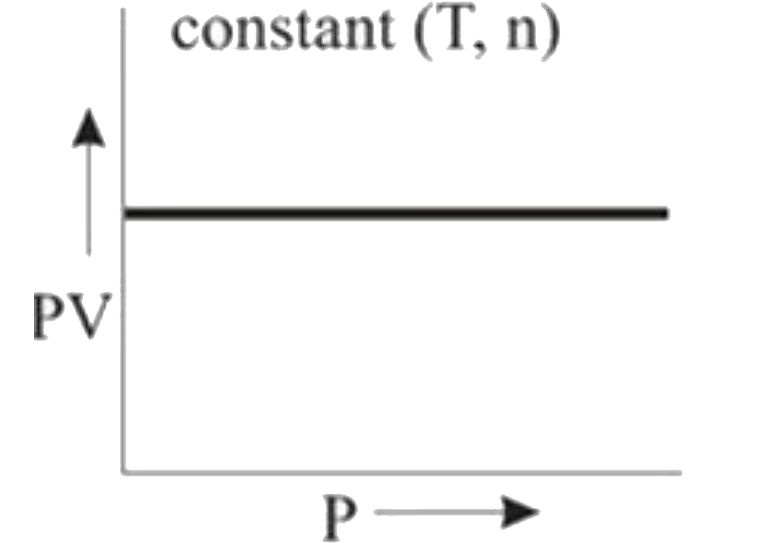
- **Graph 2 (PV vs. T)**:
- Here, T and n are constant. Since \( PV = nRT \), if T and n are constant, then PV is also constant. This results in a horizontal line (parallel to the x-axis) when plotted against T, indicating ideal behavior.
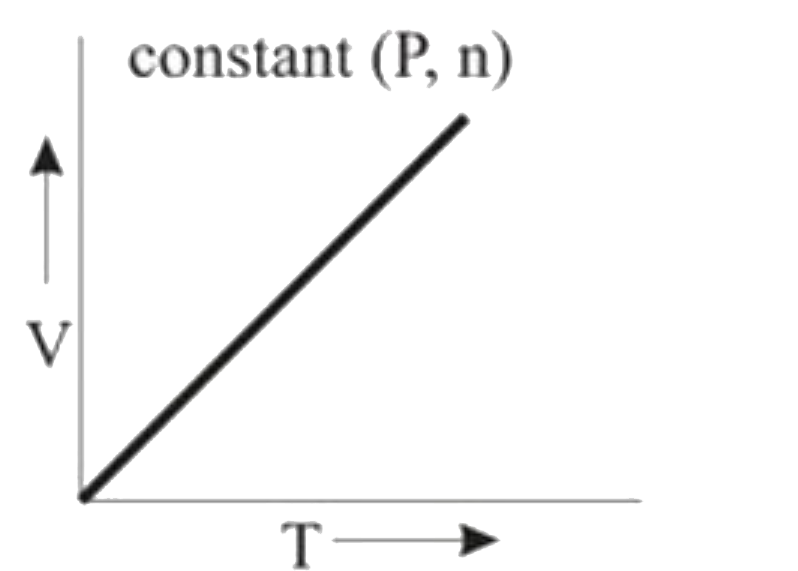
- **Graph 3 (V vs. T)**:
- In this case, P and n are constant. According to the ideal gas law, V is directly proportional to T. Thus, this graph will also be a straight line, showing no deviation from ideal behavior.
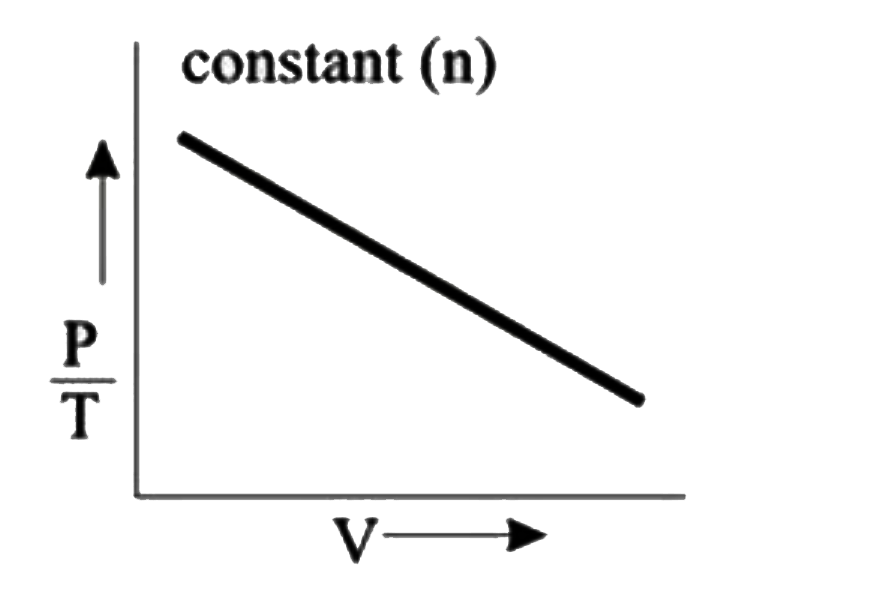
- **Graph 4 (P/T vs. V)**:
- For this graph, n is constant. From the rearranged ideal gas law \( P/T = nR/V \), we see that P/T is inversely related to V. This means that if we plot P/T against V, we should expect a hyperbolic curve. However, if the graph shows a straight line, it indicates a significant deviation from ideal behavior.
3. **Conclusion**:
Among the four graphs analyzed, Graph 4 shows the most significant deviation from ideal gas behavior because it does not conform to the expected hyperbolic relationship between \( P/T \) and V.
### Final Answer:
The graph that shows the most significant deviation from ideal gas behavior is **Graph 4**.