A
B
C
D
Text Solution
AI Generated Solution
The correct Answer is:


Similar Questions
Explore conceptually related problems
Recommended Questions
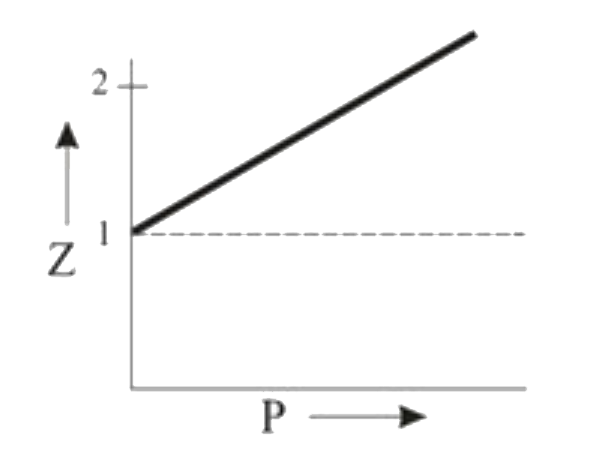
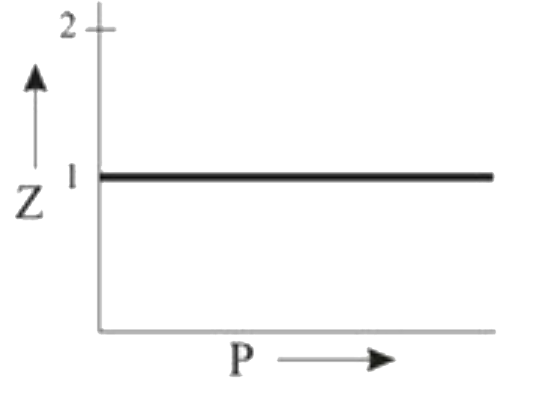
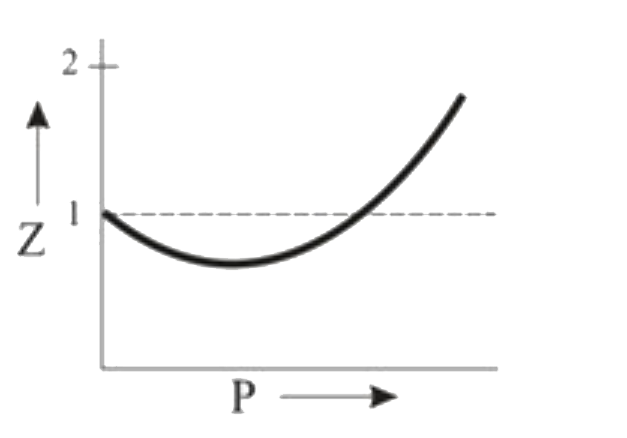
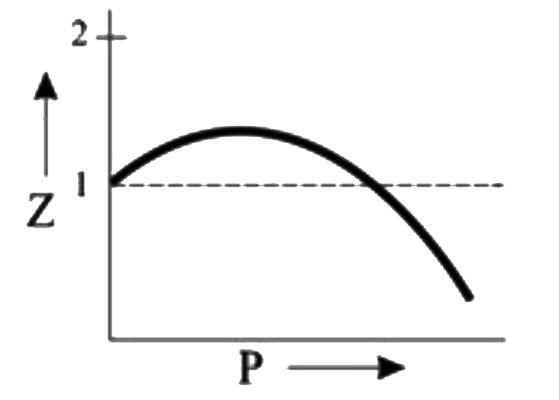
- Which of the following represents a plot of compressibility factor (Z)...
Text Solution
|
- A hot liquid is kept in a big room. Its temperature is plotted as a fu...
Text Solution
|
- In the plot of Z (compressibility factor) vs P,Z attains a value of un...
Text Solution
|
- Figure displays the plot of the compression factor Z versus P for a fe...
Text Solution
|
- Figure displays the plot of the compression factor Z veres p for a few...
Text Solution
|
- Compressibility factor (Z) is plotted against pressure at different te...
Text Solution
|
- Which of the following represents a plot of compressibility factor (Z)...
Text Solution
|
- Compressibility factor (Z) is plotted against pressure at different te...
Text Solution
|
- The given graph represents the variation of Z (compressibility factor ...
Text Solution
|