A
B
C
D
Text Solution
AI Generated Solution
The correct Answer is:


Similar Questions
Explore conceptually related problems
Recommended Questions
- Ten moles of an ideal gas are filled in a closed vessel. The vessel ha...
Text Solution
|
- For a closed container containing 100 mol of an ideal gas fitted with ...
Text Solution
|
- For a closed container containing 10 moles of an ideal gas, at constan...
Text Solution
|
- Which of the following volume (V)-temperature (T) plots represents the...
Text Solution
|
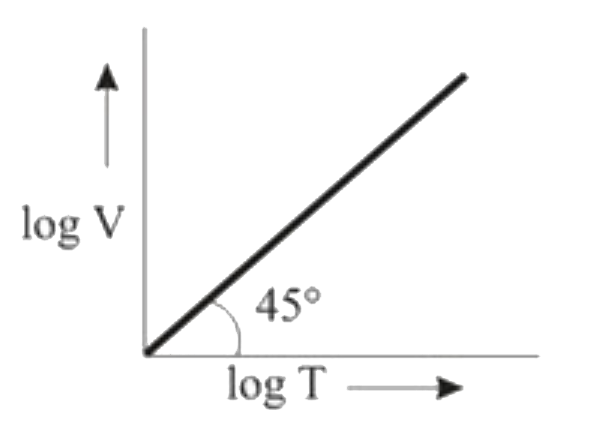
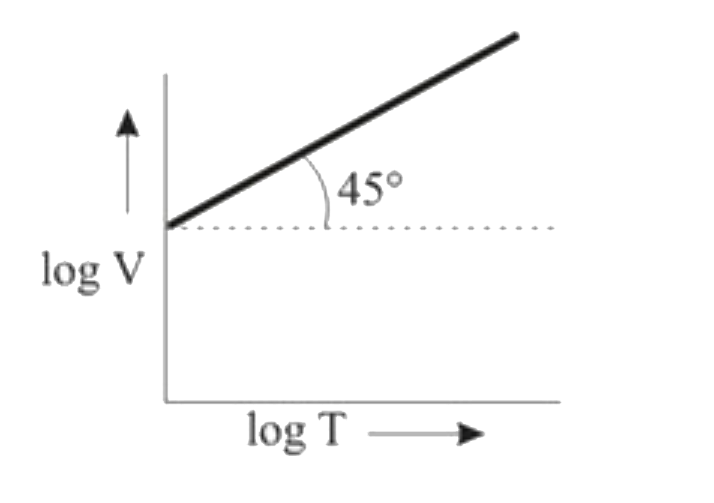
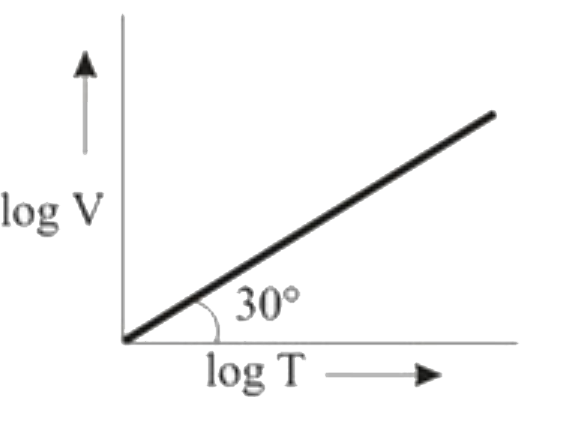
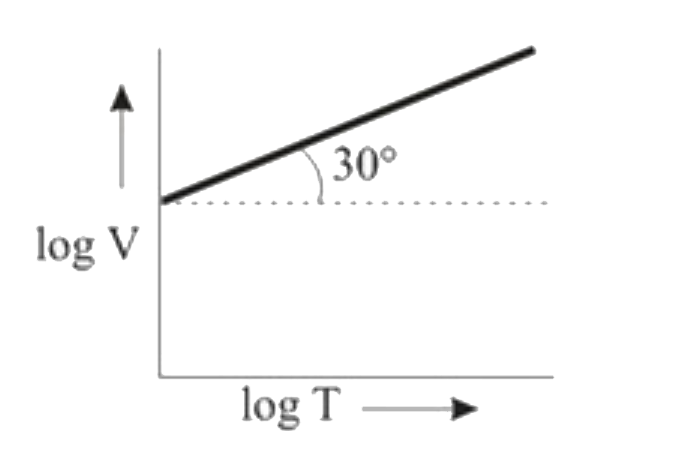
- For an ideal gas, under isobaric condition, a graph between log V vs l...
Text Solution
|
- Ten moles of an ideal gas are filled in a closed vessel. The vessel ha...
Text Solution
|
- স্থির উষ্ণতায় নির্দিষ্ট ভরের আদর্শ গ্যাসের log P বনাম log V লেখচিত্রট...
Text Solution
|
- For 1 mol ofan ideal gas at a constant temperature T, the plot of (log...
Text Solution
|
- If a graph is plotted between log V and log T for 2 moles of a gas of ...
Text Solution
|