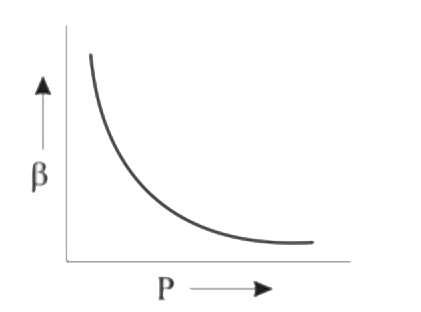
A
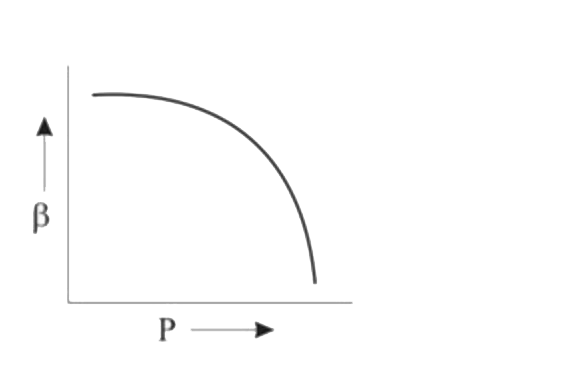
B
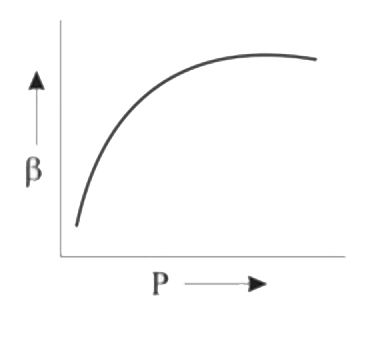
C
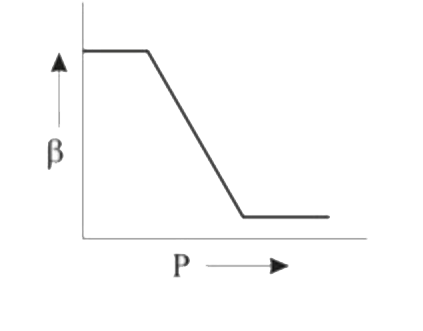
D
Text Solution
Verified by Experts
The correct Answer is:


Similar Questions
Explore conceptually related problems
Recommended Questions
- Which of the following graphs correctly represent the variation of be...
Text Solution
|
- Which of the following graphs correctly represents the variation of be...
Text Solution
|
- which of the following graphs correctly represents the vatiation beta=...
Text Solution
|
- Which of the following graphs correctly represents the variation of be...
Text Solution
|
- Which of following graphs correctly represent variation of alpha = (-(...
Text Solution
|
- Which of the following graphs correctly represents the variation of be...
Text Solution
|
- Explain that the following graph shows the values of P for ideal gas a...
Text Solution
|
- Which of the following graphs correctly represents the variation of be...
Text Solution
|
- Which of the following graphs correctly represent the variation of bet...
Text Solution
|