A
B
C
D
Text Solution
Verified by Experts
The correct Answer is:


Similar Questions
Explore conceptually related problems
Recommended Questions
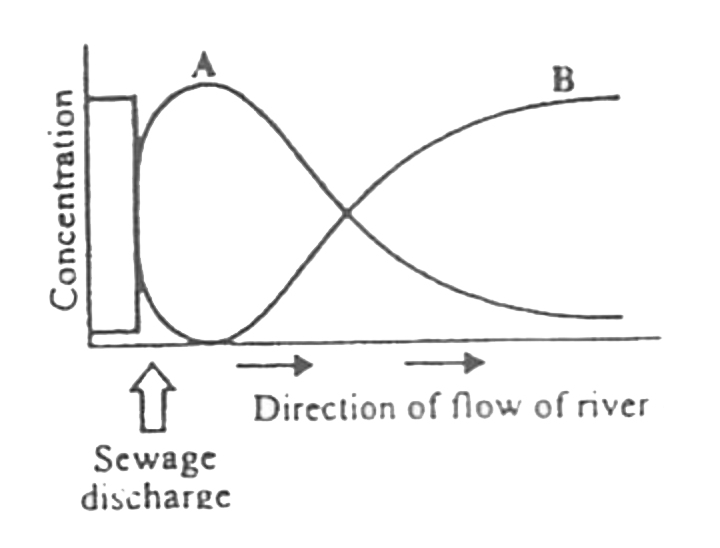
- The graph given below represents the effect of sewage discharge of som...
Text Solution
|
- The graph given below represents the effect of sewage discharge on som...
Text Solution
|
- What are the various constituents of domestic sewage ? Discuss the eff...
Text Solution
|
- What are the various constituents of domestic sewage? Discuss the effe...
Text Solution
|
- वाहित मल ( सीवेज) के नदी में विसर्जन से होने वाले प्रभावों पर टिप...
Text Solution
|
- What are the various constituents of domestic sewage? Discuss the effe...
Text Solution
|
- What are the various constituents of domestic sewage? Discuss the eff...
Text Solution
|
- Choose the correct representation of effect of sewage discharge on imp...
Text Solution
|
- The graph given below represents the effect of sewage discharge of som...
Text Solution
|