A
B
C
D
Text Solution
AI Generated Solution
The correct Answer is:


Similar Questions
Explore conceptually related problems
Recommended Questions
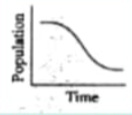
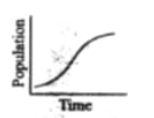
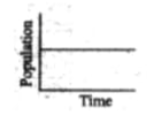
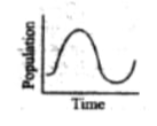
- Which of the following graph corresponds to a population of 2000 indiv...
Text Solution
|
- In a given population of 2000 indivials, 80 births and 125 deaths were...
Text Solution
|
- If birth rate is 100, death rate is 10 and number of individual in pop...
Text Solution
|
- If 8 individuals in a laboratory population of 80 fruit flies died in ...
Text Solution
|
- Give right answer of the following: (a) Number of births during a gi...
Text Solution
|
- If 4 individuals in a laboratory population of 40 fruitflies died duri...
Text Solution
|
- Which of the following graph corresponds to a population of 2000 indiv...
Text Solution
|
- Match following {:("","Column-I","","Column-II"),(A,"Mortality",1,"i...
Text Solution
|
- An individual may have births and deaths but a population has (a ...
Text Solution
|