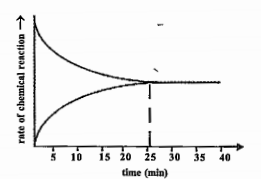
 In which minute does the system attain equilibrium?


Topper's Solved these Questions
Similar Questions
Explore conceptually related problems
BODY BOOKS PUBLICATION-COMPOUNDS OF NON-METALS-EXERCIES
- A graph given below deals with the revers-ible reaction. In which m...
Text Solution
|
- Fill in the blanks: Liquor ammonia: concentrated aquous solution of am...
Text Solution
|
- Sulphuric acid is not prepared by dissolving SO3 in water. Why?
Text Solution
|
- Ammonium chloride is used in the laboratory for the manufacture of amm...
Text Solution
|
- Ammonium chloride is used in the laboratory for the manufacture of amm...
Text Solution
|
- Ammonium chloride is used in the laboratory for the manufacture of amm...
Text Solution
|
- State the Le-Chatelier's principle.
Text Solution
|
- On the basis of Le-Chatelier's Principle explain what will be the effe...
Text Solution
|