


Similar Questions
Explore conceptually related problems
Recommended Questions
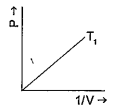
- A graph representing variation of pressure with volume at particular t...
Text Solution
|
- t1 = (sintheta)^costheta ,t2 = (sintheta)^sintheta , t3 = (costheta)^c...
Text Solution
|
- The vertices of a triangle are [a t1t2,a(t1 +t2)], [a t2t3,a(t2 +t3)],...
Text Solution
|
- The current - voltage graphs for a given metallic wire at two differen...
Text Solution
|
- If for a black body the graph of change is emissive power at different...
Text Solution
|
- The vertices of a triangle are [a t1t2,a(t1 +t2)], [a t2t3,a(t2 +t3)],...
Text Solution
|
- The vertices of a triangle are [a t1t2,a(t1 +t2)], [a t2t3,a(t2 +t3)],...
Text Solution
|
- Write the correct number in the given blanks from the following A.P.1,...
Text Solution
|
- Write the correct number in the given blanks from the following A.P.3,...
Text Solution
|