


Similar Questions
Explore conceptually related problems
Recommended Questions
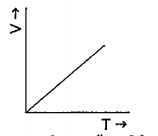
- A plot of volume against temperature is given below: Plot a graph bet...
Text Solution
|
- The pressure p for a gas is plotted against its absolute temperature T...
Text Solution
|
- The plot of volume versus pressure at constant temperature is a…………………...
Text Solution
|
- In the graph plotted between vapour pressure (V.P.) and temperature (T...
Text Solution
|
- For a planet, the graph of T^(2) against r^(3) is plotted. The slope o...
Text Solution
|
- Plot a graph between internal energy U and Temperature (T) of an ideal...
Text Solution
|
- Graph between pressure and volume are plotted at different temperature...
Text Solution
|
- A graph is plotted between pressure and volume at different temperatur...
Text Solution
|
- When a plot between logk and 1/T is plotted we get the graph as shown....
Text Solution
|