A
B
C
D
Text Solution
Verified by Experts
The correct Answer is:


Topper's Solved these Questions
WATER, SOLUTION, SOLUBILITY AND HYDROGEN
PEARSON IIT JEE FOUNDATION|Exercise CONCEPT APPLICATION (LEVEL 2)|24 VideosWATER, SOLUTION, SOLUBILITY AND HYDROGEN
PEARSON IIT JEE FOUNDATION|Exercise CONCEPT APPLICATION (LEVEL 3)|10 VideosWATER, SOLUTION, SOLUBILITY AND HYDROGEN
PEARSON IIT JEE FOUNDATION|Exercise CONCEPT APPLICATION (LEVEL 1) |1 VideosSYNTHETIC FIBRES AND PLASTICS
PEARSON IIT JEE FOUNDATION|Exercise COMPETITION CORNER (Choose the correct option)|53 Videos
Similar Questions
Explore conceptually related problems
PEARSON IIT JEE FOUNDATION-WATER, SOLUTION, SOLUBILITY AND HYDROGEN-CONCEPT APPLICATION (LEVEL 1) (MULTIPLE CHOICE QUESTIONS)
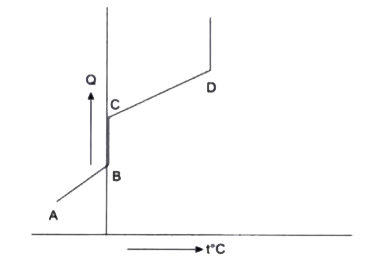
- The graph given below represents the interconversion of ice to water v...
Text Solution
|
- Which among the following is not a suspension?
Text Solution
|
- The solubility of CaSO4
Text Solution
|
- If Glauber salt, anhydrous calcium chloride, calcium oxide and concent...
Text Solution
|
- Which among the following elements does not float on water /
Text Solution
|
- 50 g of oil 'A' and 100 g of oil 'B' are taken in separate containers ...
Text Solution
|
- Anhydride of sulphurous acid is
Text Solution
|
- Which of the following compounds is not associated with water molecule...
Text Solution
|
- When two substance A and B of same mass are heated under similar condi...
Text Solution
|
- The specific heat capacity of water is
Text Solution
|
- In the given graph, identify the substance associated with the highest...
Text Solution
|
- Reaction: Non-metal + H2 A A+PbOtoPb- Non-metal If A formed in th...
Text Solution
|
- Identify the binary solution among the following .
Text Solution
|
- Hydrogen acts as an oxidizing agent when it
Text Solution
|
- Tyndal effect cannot be shown by
Text Solution
|
- Sodium catches fire and burns with a
Text Solution
|
- Which of the following metals on reaction with steam provides a coatin...
Text Solution
|
- The brown coloured substance formed when steam is passed over red hot ...
Text Solution
|
- Which among the following metals react only with steam ?
Text Solution
|
- Crystals can be made
Text Solution
|