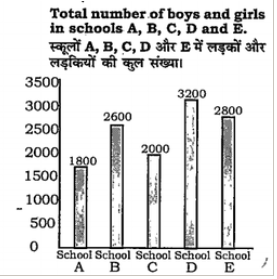
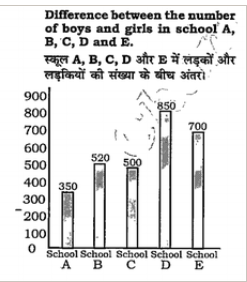
 . The number of boys in school B
is what percentage of the number of students in that school?
. The number of boys in school B
is what percentage of the number of students in that school?
A
B
C
D
Text Solution
Verified by Experts


Topper's Solved these Questions
Similar Questions
Explore conceptually related problems
CHAMPION PUBLICATION-2019 TIER-II PAPER(3)-EXERCISE
- The curved surface area of a cylinder is five times the area of a base...
Text Solution
|
- The sum of three natural numbers is 280. If the ratio between the firs...
Text Solution
|
- Study the following bar graph and answer the questions given below. ...
Text Solution
|
- In an examination, 92% of the students passed and 480 students failed....
Text Solution
|
- If sin(x+y)=cos(x-y), then find the value of cos^(2)x.
Text Solution
|
- If the perimeter of an isosceles right triangle is 8(sqrt2+1) cm, then...
Text Solution
|
- The ratio of boys and girls in a school is 27: 23. If the difference b...
Text Solution
|
- In the given figure, ABCD is a rectangle and P is a point on DC such t...
Text Solution
|
- If A’s income is 60% less than B’s income, then B’s income is what per...
Text Solution
|
- In the figure, chords AB and CD of a circle intersect externally at P....
Text Solution
|
- If x= sqrt(-sqrt3+ sqrt(3+8 sqrt(7+4 sqrt3))) where x>0, then the valu...
Text Solution
|
- In a triangle ABC, P and Q are points on AB and AC, respectively, such...
Text Solution
|
- If cosec 39^@=x, then the value of 1/( cosec^2 51^@)+sin^2 39^@+tan^2 ...
Text Solution
|
- Study the following pie chart and table to answer the question.Total n...
Text Solution
|
- Study the following pie chart and table to answer the question.Total n...
Text Solution
|
- Study the following bar graph and answer the questions given below. न...
Text Solution
|
- If the radius of a cylinder is decreased by 20% and the height is incr...
Text Solution
|
- Rahul invested equal sums of money at compound interest under two sche...
Text Solution
|
- In the given figure, the measure of angle A is: दिए गए आकृति में ang...
Text Solution
|
- The radius and height of a cylinder are in the ratio 4: 7 and its volu...
Text Solution
|