A
B
C
D
Text Solution
Verified by Experts


Topper's Solved these Questions
Similar Questions
Explore conceptually related problems
CHAMPION PUBLICATION-2014 TIER-II PAPER(18)-EXERCISE
- If sqrt(5329)=73, then the value of sqrt(5329)+sqrt(53.29)+sqrt(0.5329...
Text Solution
|
- If sqrt((1 + 27/169)) = (1 + x/13) then find the value of x.
Text Solution
|
- The sum of the cubes of two numbers is 793. The sum of the numbers is ...
Text Solution
|
- A does half as much work as B in three fourth of the times. If togethe...
Text Solution
|
- Two pipes can fill a cistern in 3 hours and 3 hours 45 minutes respect...
Text Solution
|
- 2 men and 1 woman can ccomplete a piece of work in 14 days while 4 wom...
Text Solution
|
- A and B can do a piece of work in 15 days. B and C can do a similar wo...
Text Solution
|
- A and B can do a piece of work in 45 and 40 days repectively. They beg...
Text Solution
|
- A, B and Care employed to do a plece of work for Rs. 5,290. A and B to...
Text Solution
|
- A dealer allows his cstomers a discount of 25% and still gains 25%. If...
Text Solution
|
- The difference between a discount of 30% and two successive discounts ...
Text Solution
|
- A tradesman marks his goods at 20% above the cost price. He allows his...
Text Solution
|
- If a man reduces the selling price of a fan from 1,250 to 1,000, his l...
Text Solution
|
- The ratio of two liquids in a mixture is 3:5 and that in another mixtu...
Text Solution
|
- A vessel contains 20 litres of acid. 4 litres of acid is taken out of ...
Text Solution
|
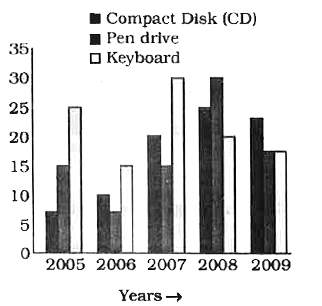
- Study the following graph which shows the production (in thousand) of ...
Text Solution
|
- Study the following graph which shows the production (in thousand) of ...
Text Solution
|
- Study the following graph which shows the production (in thousand) of ...
Text Solution
|
- Study the following graph which shows the production (in thousand) of ...
Text Solution
|
- Study the following graph which shows the production (in thousand) of ...
Text Solution
|