A
B
C
D
Text Solution
Verified by Experts


Topper's Solved these Questions
Similar Questions
Explore conceptually related problems
CHAMPION PUBLICATION-2012 TIER-II PAPER(22)-EXERCISE
- If 0^@ lt theta lt 90^@, then the value of sin theta + cos theta is
Text Solution
|
- An aeroplane when flying at a height of 5000 m from the ground ...
Text Solution
|
- The angles of a triangle are in Arithmetic Progression. The ratio of t...
Text Solution
|
- Suppose DeltaABC be a right-angled triangle where angleA= 90^@ and AD ...
Text Solution
|
- Two circles touch each other externally at P. AB is a direct common ta...
Text Solution
|
- The length of the common chord of two intersecting circles is 24 cm. I...
Text Solution
|
- In DeltaABC, D and E are points on AB and AC respectively such that DE...
Text Solution
|
- The area of the square inscribed in a circle of radius 8 cm is
Text Solution
|
- X and Y are centres of circles of a radii 9 cm and 2 cm respectively, ...
Text Solution
|
- I is the incentre of a triangle ABC. If /ABC = 65^@ and /ACB = 55^@, t...
Text Solution
|
- If the radii of two circles be 6 cm and 3 cm and the length of the tra...
Text Solution
|
- The ratio between the number of sides of two regular Polygons is 1:2 a...
Text Solution
|
- Find minimum value of sin^(2)theta+cosec^(2)theta+cos^(2)theta+sec^(...
Text Solution
|
- If 2sin((pi)/(2))=x^(2)+(1)/(x^(2)), then the value of (x-(1)/(x)) i...
Text Solution
|
- The expression (tan 57^@ + cot37^@)/(tan 33^@ + cot 53^@) is equal to
Text Solution
|
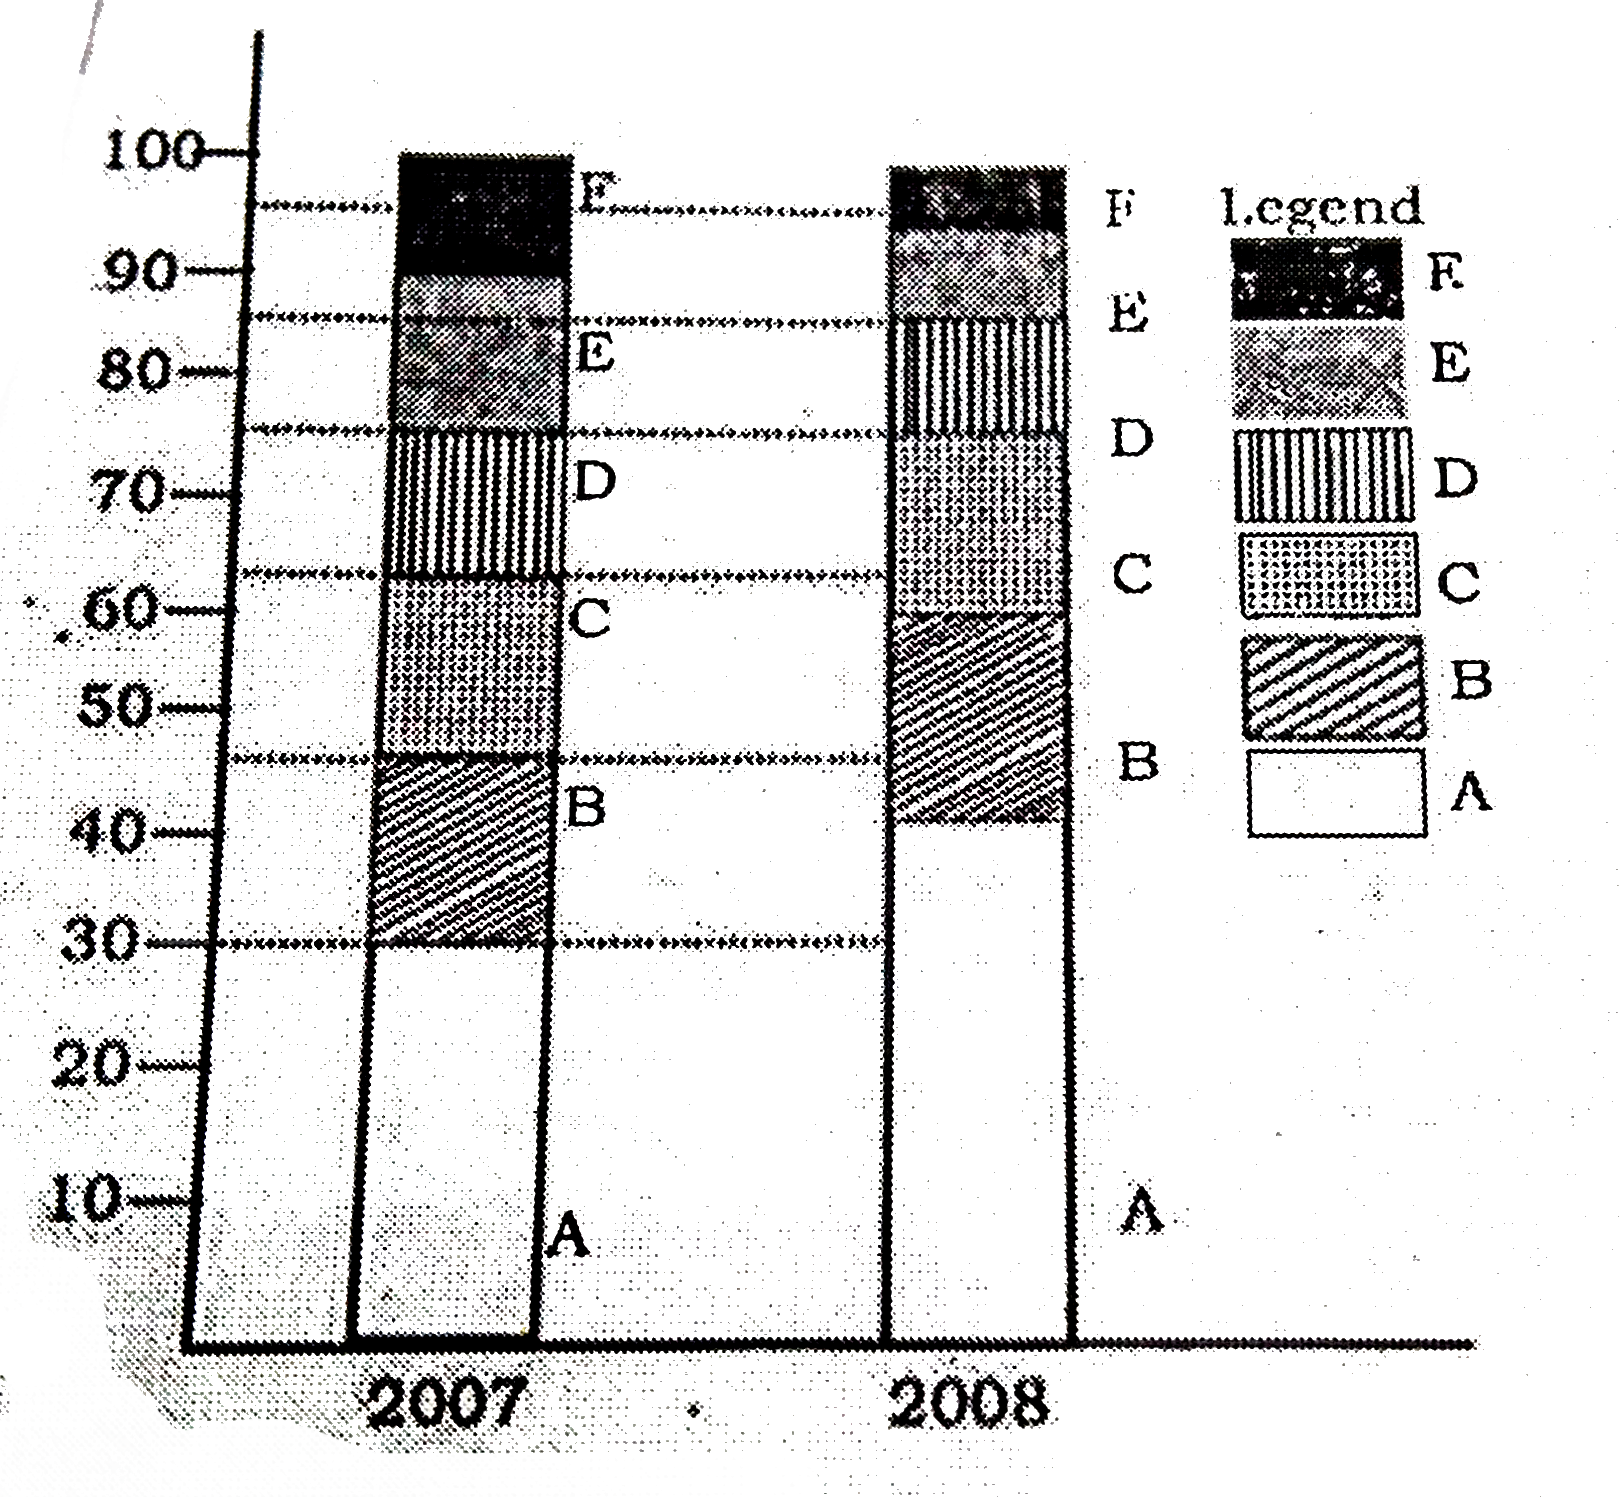
- The bar chart given below shows the percentage distribution of the pro...
Text Solution
|
- The bar chart given below shows the percentage distribution of the pro...
Text Solution
|
- The bar chart given below shows the percentage distribution of the pro...
Text Solution
|
- The bar chart given below shows the percentage distribution of the pro...
Text Solution
|
- The bar chart given below shows the percentage distribution of the pro...
Text Solution
|