Home
Class 14
MATHS
The bar graph provided below represents ...

The bar graph provided below represents the production of rice and wheat in different states of a country in the certain year. Answer the questions based on the bar graph.
नीचे दिये गया बार-ग्राफ एक निश्चित वर्ष में विभिन्न प्रदेशों में चावल और गेहूँ की उपज को दर्शाता है। इस ग्राफ पर आधारित प्रश्नों के उत्तर दें।
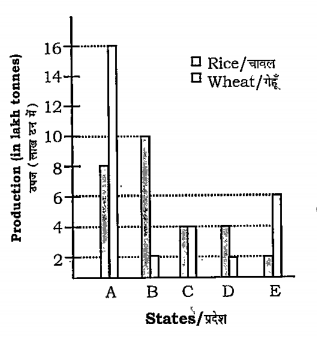
The total production of rice and wheat in all the mentioned states in minimum in the state.
दिये गये सभी प्रदेशों में से किस प्रदेश में चावल व गेहूँ को कुल उपज सबसे कम है?

A

B

B

C

C

D

D

E

Text Solution

Verified by Experts

Promotional Banner

Topper's Solved these Questions

  • 2010 TIER-II PAPER(24)

    CHAMPION PUBLICATION|Exercise EXERCISE|100 Videos
  • 2012 TIER-II PAPER(22)

    CHAMPION PUBLICATION|Exercise EXERCISE|100 Videos

Similar Questions

Explore conceptually related problems

The bar graph provided below represents the production of rice and wheat in different states of a country in the certain year. Answer the questions based on the bar graph. नीचे दिये गया बार-ग्राफ एक निश्चित वर्ष में विभिन्न प्रदेशों में चावल और गेहूँ की उपज को दर्शाता है। इस ग्राफ पर आधारित प्रश्नों के उत्तर दें। The ratio of total production of rice in the mentioned states to that of wheat in those states, is दिये गये प्रदेशों में चावल की कुल उपज का गेहूँ की कुल उपज से अनुपात है-

The bar graph provided below represents the production of rice and wheat in different states of a country in the certain year. Answer the questions based on the bar graph. नीचे दिये गया बार-ग्राफ एक निश्चित वर्ष में विभिन्न प्रदेशों में चावल और गेहूँ की उपज को दर्शाता है। इस ग्राफ पर आधारित प्रश्नों के उत्तर दें। The average of production of rice in the mentioned states (in lakh tonnes) is दिये गये प्रदेशों में चावल की उपज का औसत (लाख टनों में) है-

The bar graph provided below represents the production of rice and wheat in different states of a country in the certain year. Answer the questions based on the bar graph. नीचे दिये गया बार-ग्राफ एक निश्चित वर्ष में विभिन्न प्रदेशों में चावल और गेहूँ की उपज को दर्शाता है। इस ग्राफ पर आधारित प्रश्नों के उत्तर दें। The difference between the production in rice and wheat is maximum in- चावल की उपज और गेहूँ की उपज में अधि कतम अंतर है-

Study the graph and answer the question. Total production of wheat in states A, B and E is what percentage less than the total production of rice in states C, D and E?

Study the graph and answer the question Total production of wheat in states A , B and E is what percentage less than the total production of rice in states C, D and E?

Study the graph and answer the question the ratio of the total production of rice in states C and E to the total production of wheat in states B and D is……..

The following graph shows the sales of cars (in thousands) in four cities in 4 years. Study the graph and answer the questions. निम्नलिखित आरेख 4 वर्षों में चार शहरों में कारों की बिक्री (हज़ार में) को दर्शाता है। इस आरेख का अध्ययन कीजिए तथा प्रश्नों के उत्तर दीजिए। Which city has the highest percentage of sales, and in which year? किस शहर की बिक्री का प्रतिशत सबसे अधिक है तथा किस वर्ष में?

CHAMPION PUBLICATION-2011 TIER-II PAPER(23)-EXERCISE
  1. The following line diagram represents the yearly sales figure of a com...

    Text Solution

    |

  2. The following line diagram represents the yearly sales figure of a com...

    Text Solution

    |

  3. The following line diagram represents the yearly sales figure of a com...

    Text Solution

    |

  4. The following line diagram represents the yearly sales figure of a com...

    Text Solution

    |

  5. The following line diagram represents the yearly sales figure of a com...

    Text Solution

    |

  6. The following table shows the number of students of 7 college particip...

    Text Solution

    |

  7. The following table shows the number of students of 7 college particip...

    Text Solution

    |

  8. The following table shows the number of students of 7 college particip...

    Text Solution

    |

  9. The following table shows the number of students of 7 college particip...

    Text Solution

    |

  10. The following table shows the number of students of 7 college particip...

    Text Solution

    |

  11. The pie-chart provided below gives the distribution of land (in a vill...

    Text Solution

    |

  12. The pie-chart provided below gives the distribution of land (in a vill...

    Text Solution

    |

  13. The pie-chart provided below gives the distribution of land (in a vill...

    Text Solution

    |

  14. The pie-chart provided below gives the distribution of land (in a vill...

    Text Solution

    |

  15. The pie-chart provided below gives the distribution of land (in a vill...

    Text Solution

    |

  16. The bar graph provided below represents the production of rice and whe...

    Text Solution

    |

  17. The bar graph provided below represents the production of rice and whe...

    Text Solution

    |

  18. The bar graph provided below represents the production of rice and whe...

    Text Solution

    |

  19. The bar graph provided below represents the production of rice and whe...

    Text Solution

    |

  20. The bar graph provided below represents the production of rice and whe...

    Text Solution

    |