Home
Class 14
MATHS
The pie chart given below shows the expe...

The pie chart given below shows the expenditure on various items and savings of a family during the year 2009. Study the pie chart and answer these questions.
नीचे दिया गया याई-चार्ट वर्ष २००९ में एक परिवार द्वारा विभिन्न मदों पर व्यय की गई धनराशि तथा बचत को प्रदर्शित करता है। पाईं-चार्ट का अध्ययन कीजिये तथा इस पर आधारित प्रश्नों का उत्तर दीजिये-
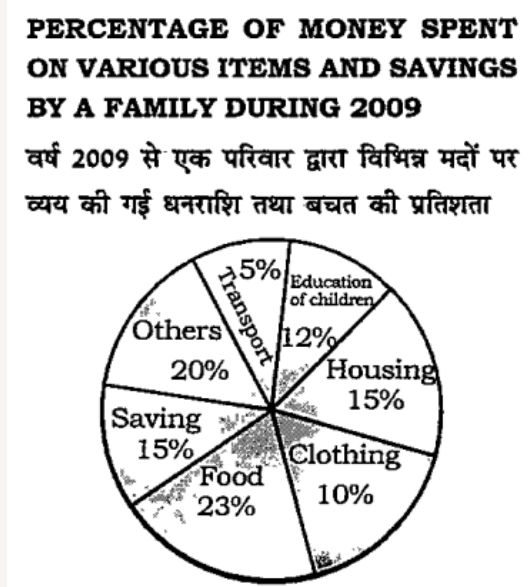
Maximum expenditure of the family other than on food, was on
परिवार द्वारा किसी मद पर भोजन के सिवाय सर्वाधिक व्यय किया गया?

A

Food/ भोजन

B

Housing /आवास

C

Education of children/ बच्चों को शिक्षा

D

Clothing /वस्र

Text Solution

Verified by Experts

Promotional Banner

Topper's Solved these Questions

  • 2011 TIER-II PAPER(23)

    CHAMPION PUBLICATION|Exercise EXERCISE|100 Videos

Similar Questions

Explore conceptually related problems

The pie chart given below shows the expenditure on various items and savings of a family during the year 2009. Study the pie chart and answer these questions. नीचे दिया गया याई-चार्ट वर्ष २००९ में एक परिवार द्वारा विभिन्न मदों पर व्यय की गई धनराशि तथा बचत को प्रदर्शित करता है। पाईं-चार्ट का अध्ययन कीजिये तथा इस पर आधारित प्रश्नों का उत्तर दीजिये- If the total income of the family for the year 2009 was Rs.1,50,000 then the difference between the expenditures on housing and transport was यदि वर्ष 2009 में परिवार को कुल आय 1,50,000 रुपये रही हो, तो आवास तथा परिवहन पर किये गये व्ययों का अंतर था?

The pie chart given below shows the expenditure on various items and savings of a family during the year 2009. Study the pie chart and answer these questions. The percentage of the income which was spent on clothing, education of children and transport together is-

The pie chart given below shows the monthly expenses on various heads of a family . The total expenditure of the family is Rs 30000. What is the amount (in Rs) spent on food ?

The pie chart given below shows the spendings of a family on various heads during a month. Study the graph and answer the questions Expenditure on Rent is what percent of expenditure on Fuel?

The following pie chart shows the monthly expenditure incurred by a family on various items, and their savings. Study the chart and answer the question that follows निम्नलिखित पाई चार्ट विभिन्न मदों पर एक परिवार द्वारा किए गए मासिक खर्च और उनकी बचत को दर्शाता है। चार्ट का अध्ययन करें और फिर पूछे गए प्रश्न का उत्तर दें। If the expenditure on education is 2,700 more than that on housing, then the total expenditure on food and clothings is: यदि शिक्षा पर खर्च आवास से ₹2,700 अधिक है, तो भोजन और कपड़े पर कुल खर्च ज्ञात करे।

The given pie-chart, shows the percentage distribution of the expenditure incurred in publishing a book. Study the pie-chart and the answer the question based on it. / दिया गया पाई चार्ट किसी पुस्तक के प्रकाशन में हुए व्ययों के प्रतिशत वितरण को दर्शाता है | इस पाई चार्ट का अध्ययन करें तथा इस पर आधारित प्रश्न का उत्तर दें | In the given pie-chart, by what percentage the Royalty on the book is less than the Printing cost? / दिए गए पाई चार्ट के अनुसार, इस पुस्तक पर रॉयल्टी प्रकाशन की लागत से कितना प्रतिशत कम है ?

The pie chart given below shows the spendings of a family on various heads during a month. Study the graph and answer the questions Which three expenditures together have a central angle of 108^(@) ?

CHAMPION PUBLICATION-2010 TIER-II PAPER(24)-EXERCISE
  1. If the radius of a sphere is increased by 2m, its surface area is incr...

    Text Solution

    |

  2. A right circular cylinder is circumscribing a hemisphere such that the...

    Text Solution

    |

  3. A man invested 1/3 of his capital at 7%, 1/4 at 8% and the remaining a...

    Text Solution

    |

  4. The compound interest on Rs. 6250 at 12% per annum for 1 year, compoun...

    Text Solution

    |

  5. A sum of money lent at compound interest amounts to Rs. 1460 in 2 year...

    Text Solution

    |

  6. If A travels to his school from his house at the speed of 3 km/hr. the...

    Text Solution

    |

  7. A train travelling with a speed of 60 km/hr catches another train trav...

    Text Solution

    |

  8. A and B together can complete a piece of working 12 days and B and C t...

    Text Solution

    |

  9. 4 men and 6 women together can complete a work in 8 days while 3 men a...

    Text Solution

    |

  10. The average of two numbers A and B is 20, that of B and C is 19 and of...

    Text Solution

    |

  11. The pie chart given below shows the expenditure on various items and s...

    Text Solution

    |

  12. The pie chart given below shows the expenditure on various items and s...

    Text Solution

    |

  13. The pie chart given below shows the expenditure on various items and s...

    Text Solution

    |

  14. The pie chart given below shows the expenditure on various items and s...

    Text Solution

    |

  15. The pie chart given below shows the expenditure on various items and s...

    Text Solution

    |

  16. Study the following table and answer the questions वर्ष 2010 से 2...

    Text Solution

    |

  17. Study the bar diagram and answer these questions. नीचे दिये गया बार ...

    Text Solution

    |

  18. Study the bar diagram and answer these questions. नीचे दिये गया बार ...

    Text Solution

    |

  19. Study the bar diagram and answer these questions. नीचे दिये गया बार ...

    Text Solution

    |

  20. Study the bar diagram and answer these questions. नीचे दिये गया बार ...

    Text Solution

    |