


Topper's Solved these Questions
Similar Questions
Explore conceptually related problems
BEYOND PUBLICATION-OUR ENVIRONMENT-EXERCISE
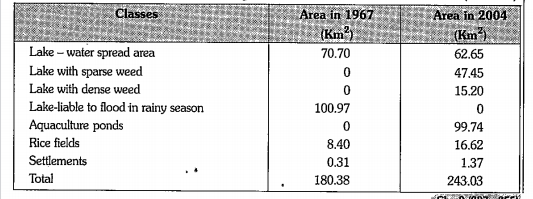
- Obsere the data given in the following table. In which year lake - wa...
Text Solution
|
- What does a food chain always start with?
Text Solution
|
- Which of the following do palnts not compete for?
Text Solution
|
- Ban al pesticides, this means that
Text Solution
|
- According to charles eiton
Text Solution
|
- The ground flora of Tundra constitute
Text Solution
|
- Reindeer can be seen in
Text Solution
|
- Sporadic rainfall is present in
Text Solution
|
- Domination of grass species can be seen in
Text Solution
|
- Rich flora and fauna can be seen here
Text Solution
|
- Desert Ship?
Text Solution
|
- What is correct for the artificial ecosystem ?
Text Solution
|
- Which of the following acts as a primary as well a secondary consumer ...
Text Solution
|
- Example for non-biodegradable pesticide
Text Solution
|
- The food by its nature is
Text Solution
|
- The amount of energy available at successive trophiclevels
Text Solution
|
- Read the following statements and select the correct option: (a) In...
Text Solution
|
- The following per cent of energy dissipated at each energy transfer
Text Solution
|
- The correct path of energy flow in an ecosystem is
Text Solution
|
- In ecological pyramids, producers are represented here
Text Solution
|
- Which of the following is an autotroph ?
Text Solution
|