A
B
C
D
Text Solution
Verified by Experts


Topper's Solved these Questions
Similar Questions
Explore conceptually related problems
BEYOND PUBLICATION-NATURAL RESOURCES-EXERCISE
- The zone of atmosphere in which the ozone layer is present is called
Text Solution
|
- Give an example for biofuel .
Text Solution
|
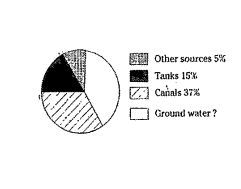
- In the above pie diagram , sources v area under irrgation is shown . T...
Text Solution
|
- What are renewable sources and non-renewable resources ?
Text Solution
|
- If deforestation is done in large scale, what natural calamity may occ...
Text Solution
|
- This is not a method of saving fuel.
Text Solution
|
- Name the major particulate pollutants present in Troposphere.
Text Solution
|
- UNDP means....
Text Solution
|
- How are fuels like coal and petroleum formed ?
Text Solution
|
- Ramya gave her old books to her sister. Which type of conservation met...
Text Solution
|
- What are the disadvantages of deforestation ?
Text Solution
|
- This is not a method of saving fuel.
Text Solution
|
- Major air pollutant is
Text Solution
|
- What are the alternative ways to increase the underground water resour...
Text Solution
|
- Expand ICRISAT.
Text Solution
|
- In United States nearly one - third of the iron is produced from old a...
Text Solution
|
- If we utilize the fuel at the same rate which we are utilizing now, we...
Text Solution
|
- What method do you prefer to increase ground water table ?
Text Solution
|
- Which among the following is soil conservation method ?
Text Solution
|
- You have installed LED bulbs inspite of other bulbs. The conservative ...
Text Solution
|