Home
Class 12
MATHS
Plot y=sinxa n dy=2sinxdot...

Plot `y=sinxa n dy=2sinxdot`

Text Solution

Verified by Experts

We have `y=sin2x.`
Since the period of `y=sin2x" is "(2pi)/(2)=pi`, the graph completes its one cycle in the interval of length `pi`.
In any interval of length `pi`, sin 2x takes all its values, which are [-1,1].
So graph of `y=sin2x" for "x in[0,pi]` is as follows.

Thus, the graph of `y=sinx` is compressed by 2 units horizontally.
In `[0,2pi],y=sin2x` completes its two cycles.
Promotional Banner

Similar Questions

Explore conceptually related problems

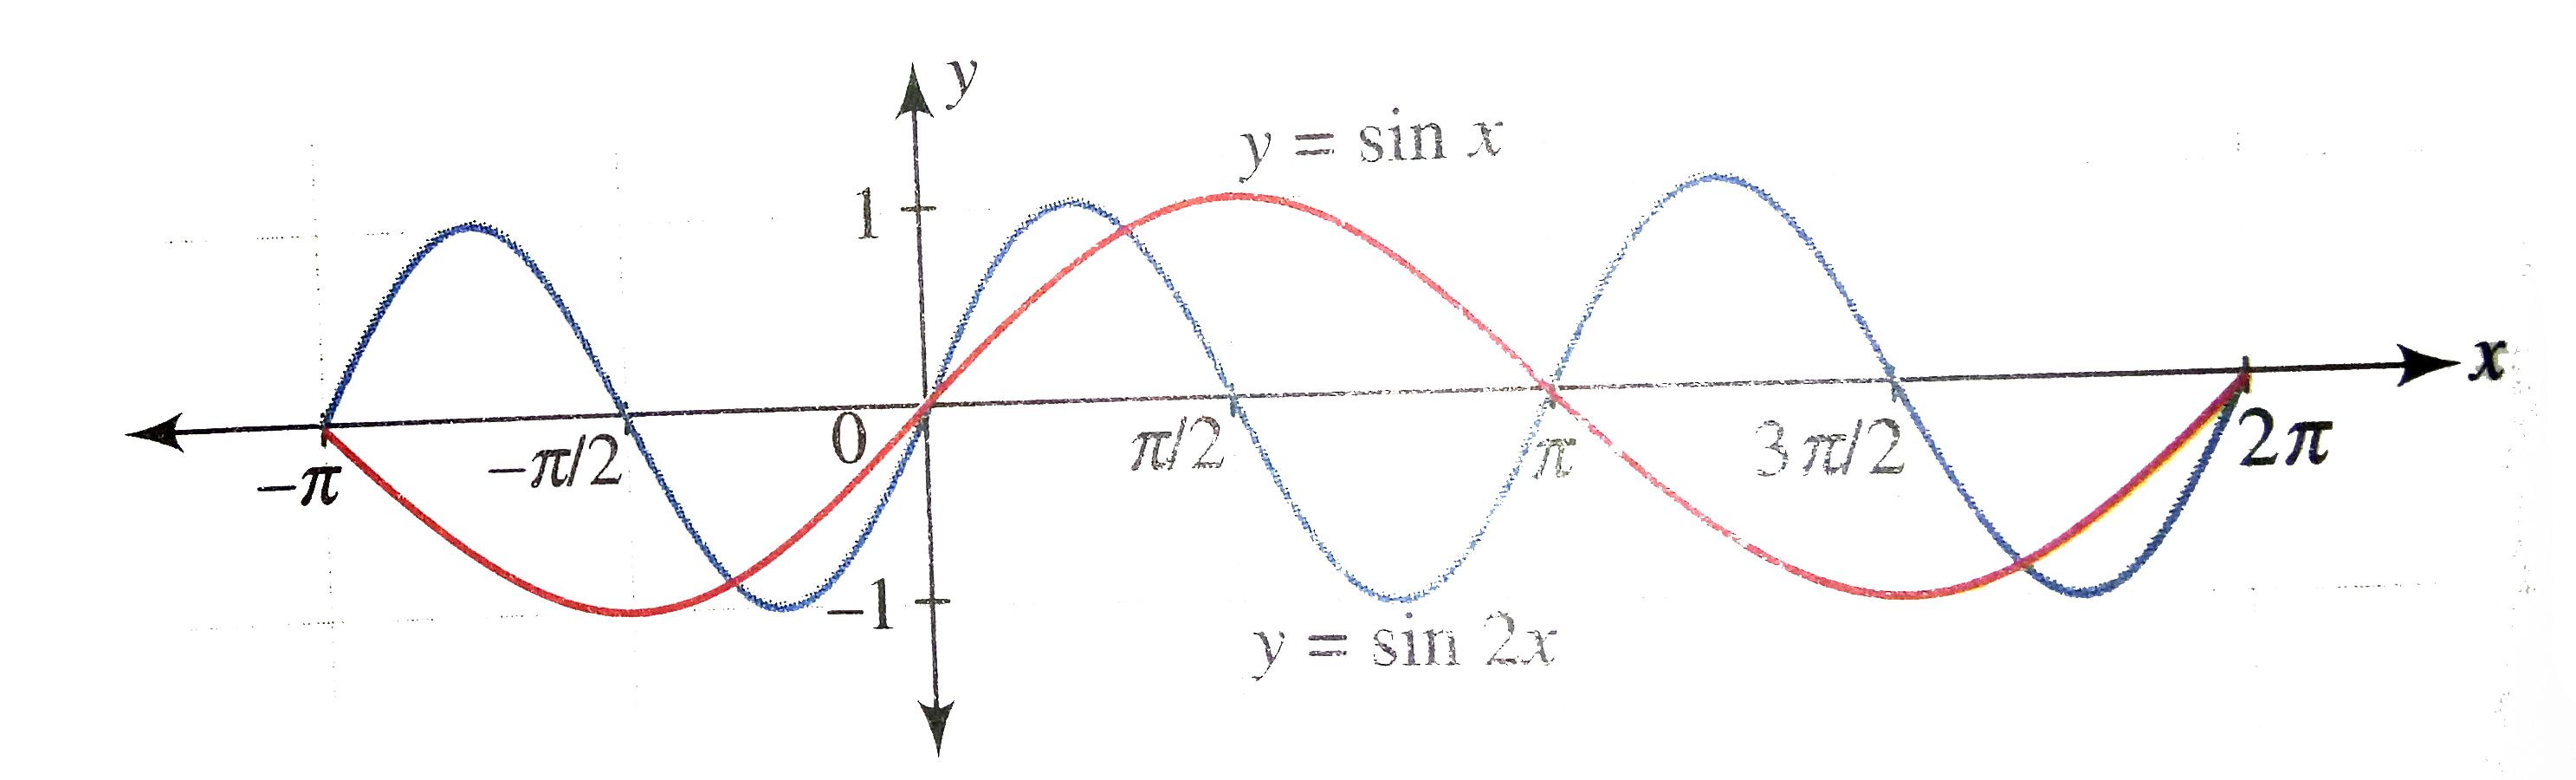
Plot y=sinxa n dy=sin2xdot

Plot y=sinxa n dy=sin(x/2)

Find the area of the region enclosed by the curves y=xlogxa n dy=2x-2x^2dot

Find the angle between the curves 2y^2=x^3a n dy^2=32 xdot

The number of points of intersection of two curves y=2sinxa n dy=5x^2+2x+3i s a . 0 b. 1 c. 2 d. oo

Which of the following pair of graphs intersect? y=x^2-xa n dy=1 y=x^2-2x +3 and y=sinx y=x^2-x+1a n dy=x-4

Statement 1: Both sinxa n dcosx are decreasing functions in (pi/2,pi) Statement 2: If a differentiable function decreases in an interval (a , b), then its derivative also decreases in (a , b) .

If y=sinp xa n dy_n is the n t h derivative of y , then |[y, y_1,y_2],[y_3,y_4,y_5],[y_6,y_7,y_8]|i s (a)1 (b) 0 (c) -1 (d) none of these

Does there exists line/lines which is/are tangent to the curve y=sinxa t(x_1, y_1) and normal to the curve at (x_2, y_2)?

Does there exists line/lines which is/are tangent to the curve y=sinxa t(x_1, y_1) and normal to the curve at (x_2, y_2)?