`y=f(x)=(x)/(1-|x|)={{:((x)/(1-x)", " x ge0", " x!=1),((x)/(1+x)", "xlt0", " x!=-1):}`
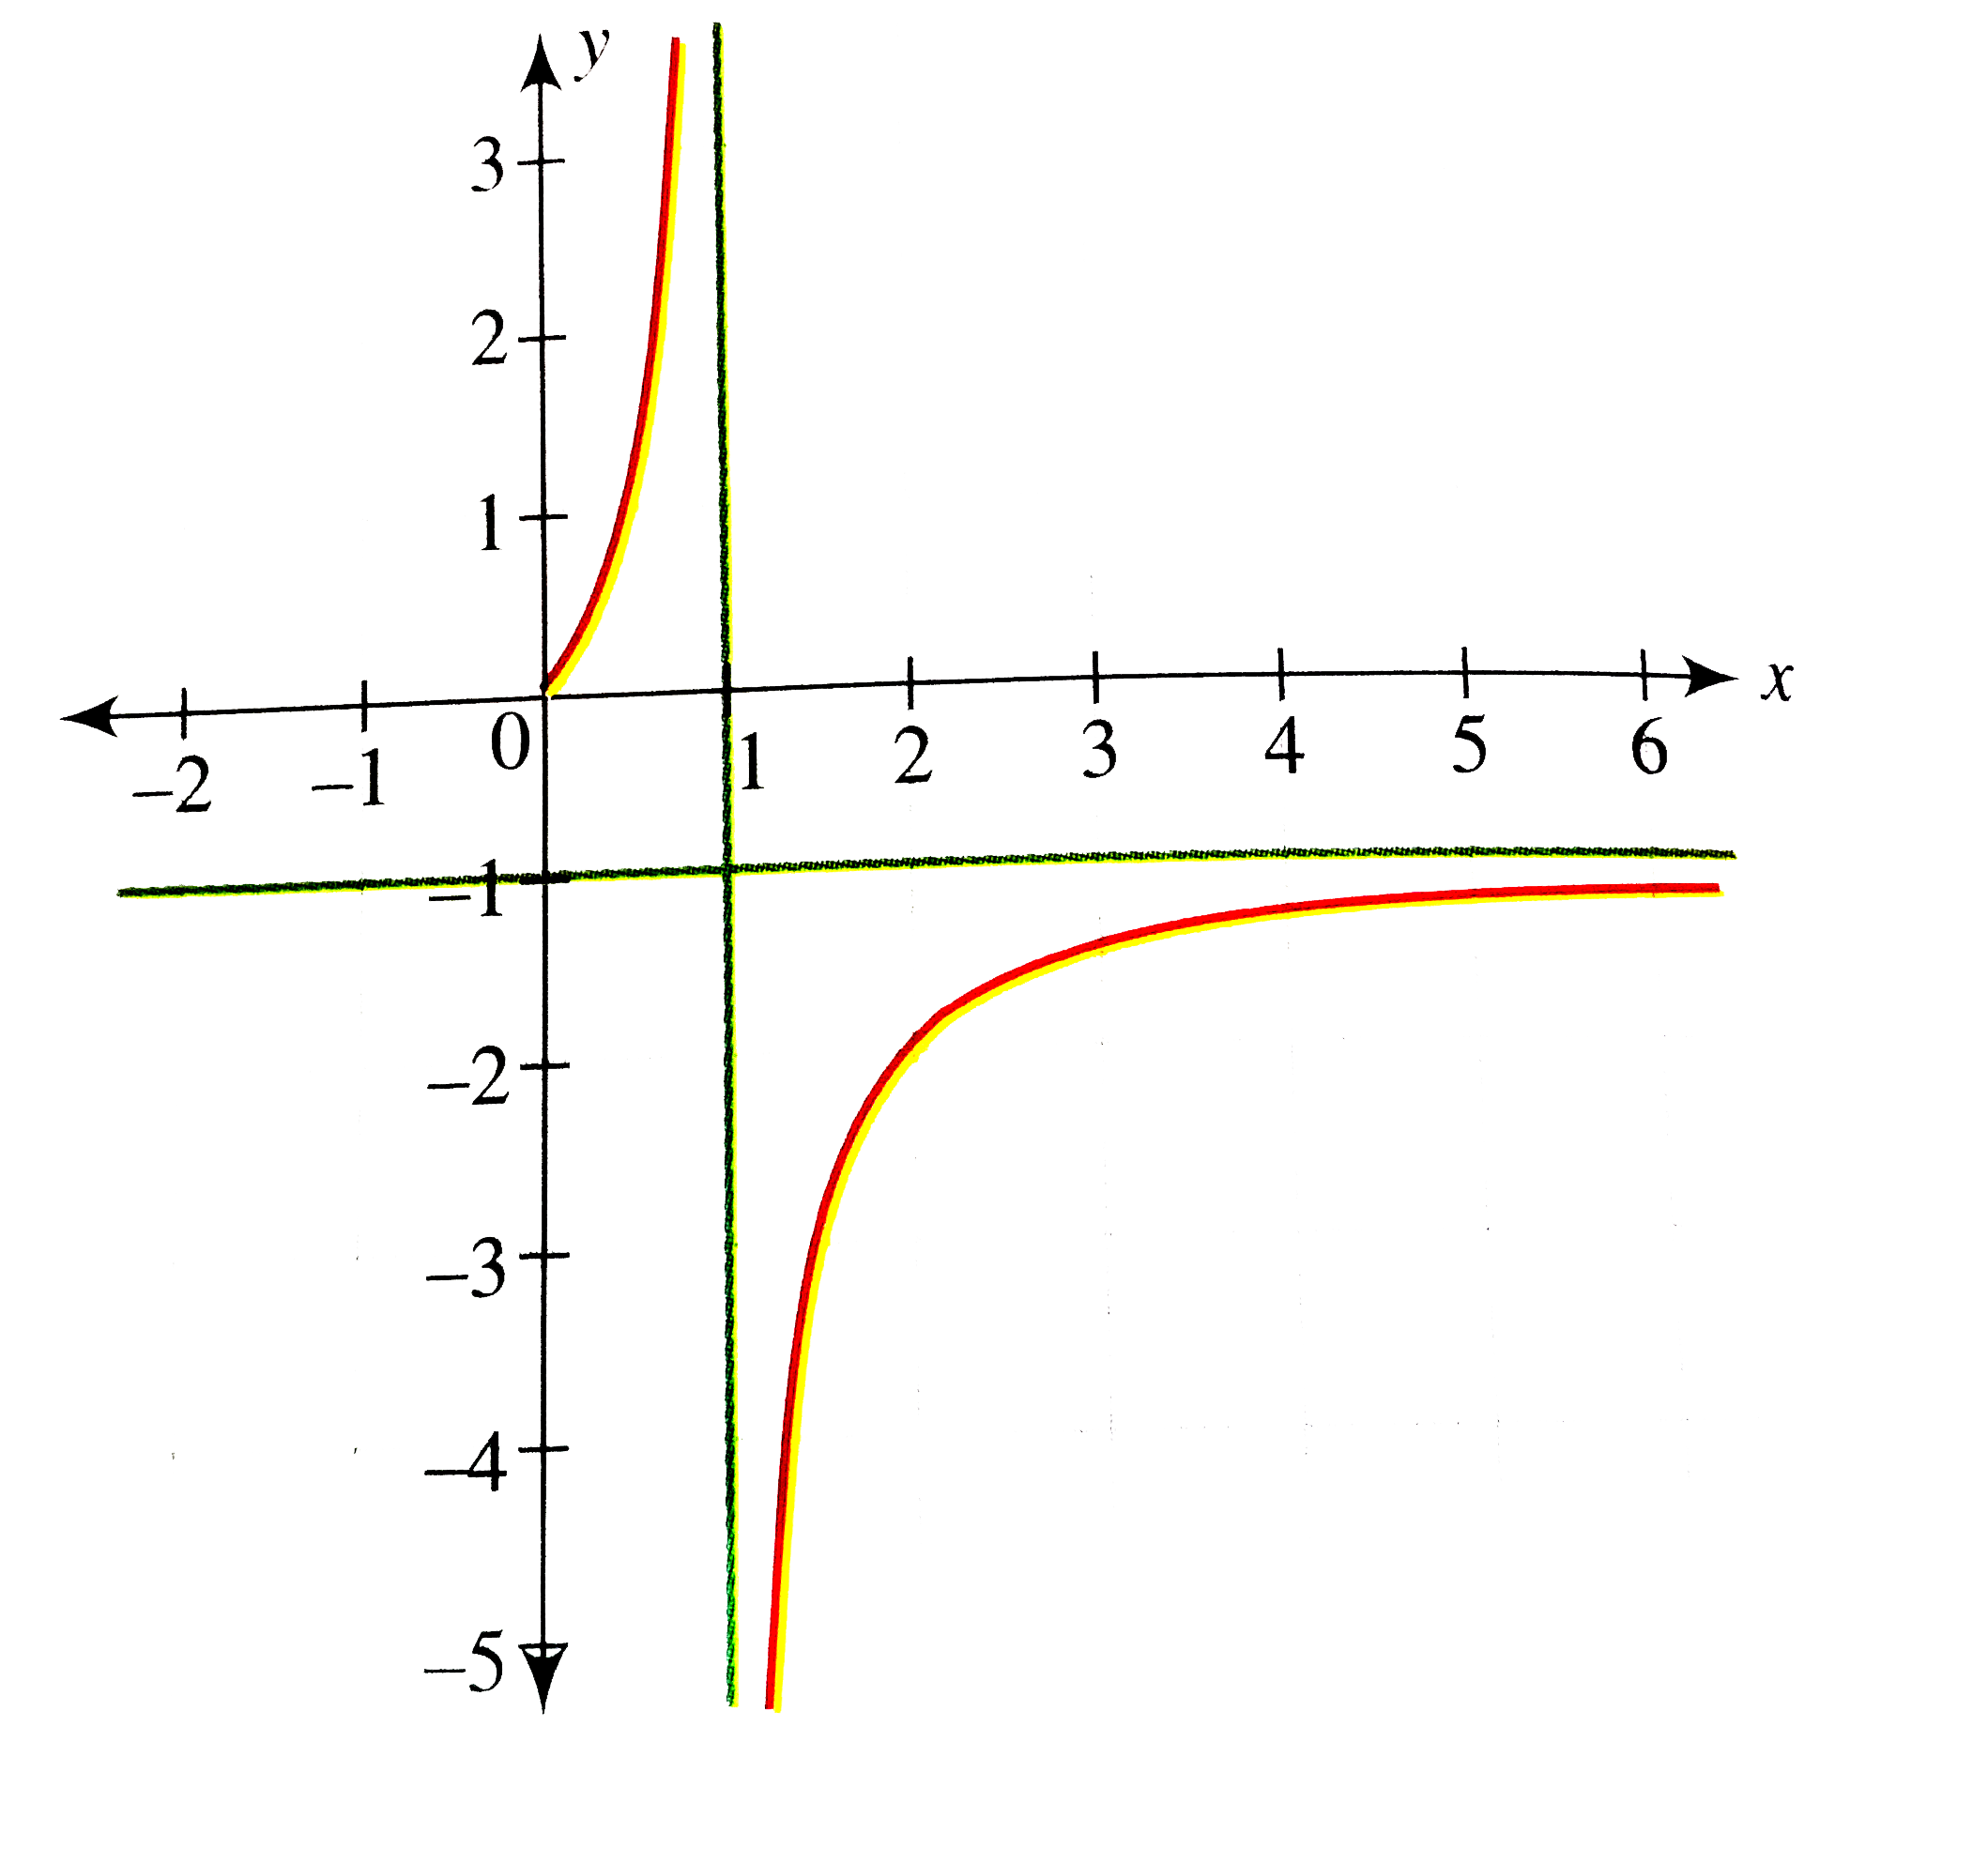
`y=(x)/(1-x)=(1)/(1-x)-1`
So `(y+1)(x-1)=1`, which is a rectangular hyperbola having centre at (1,-1).
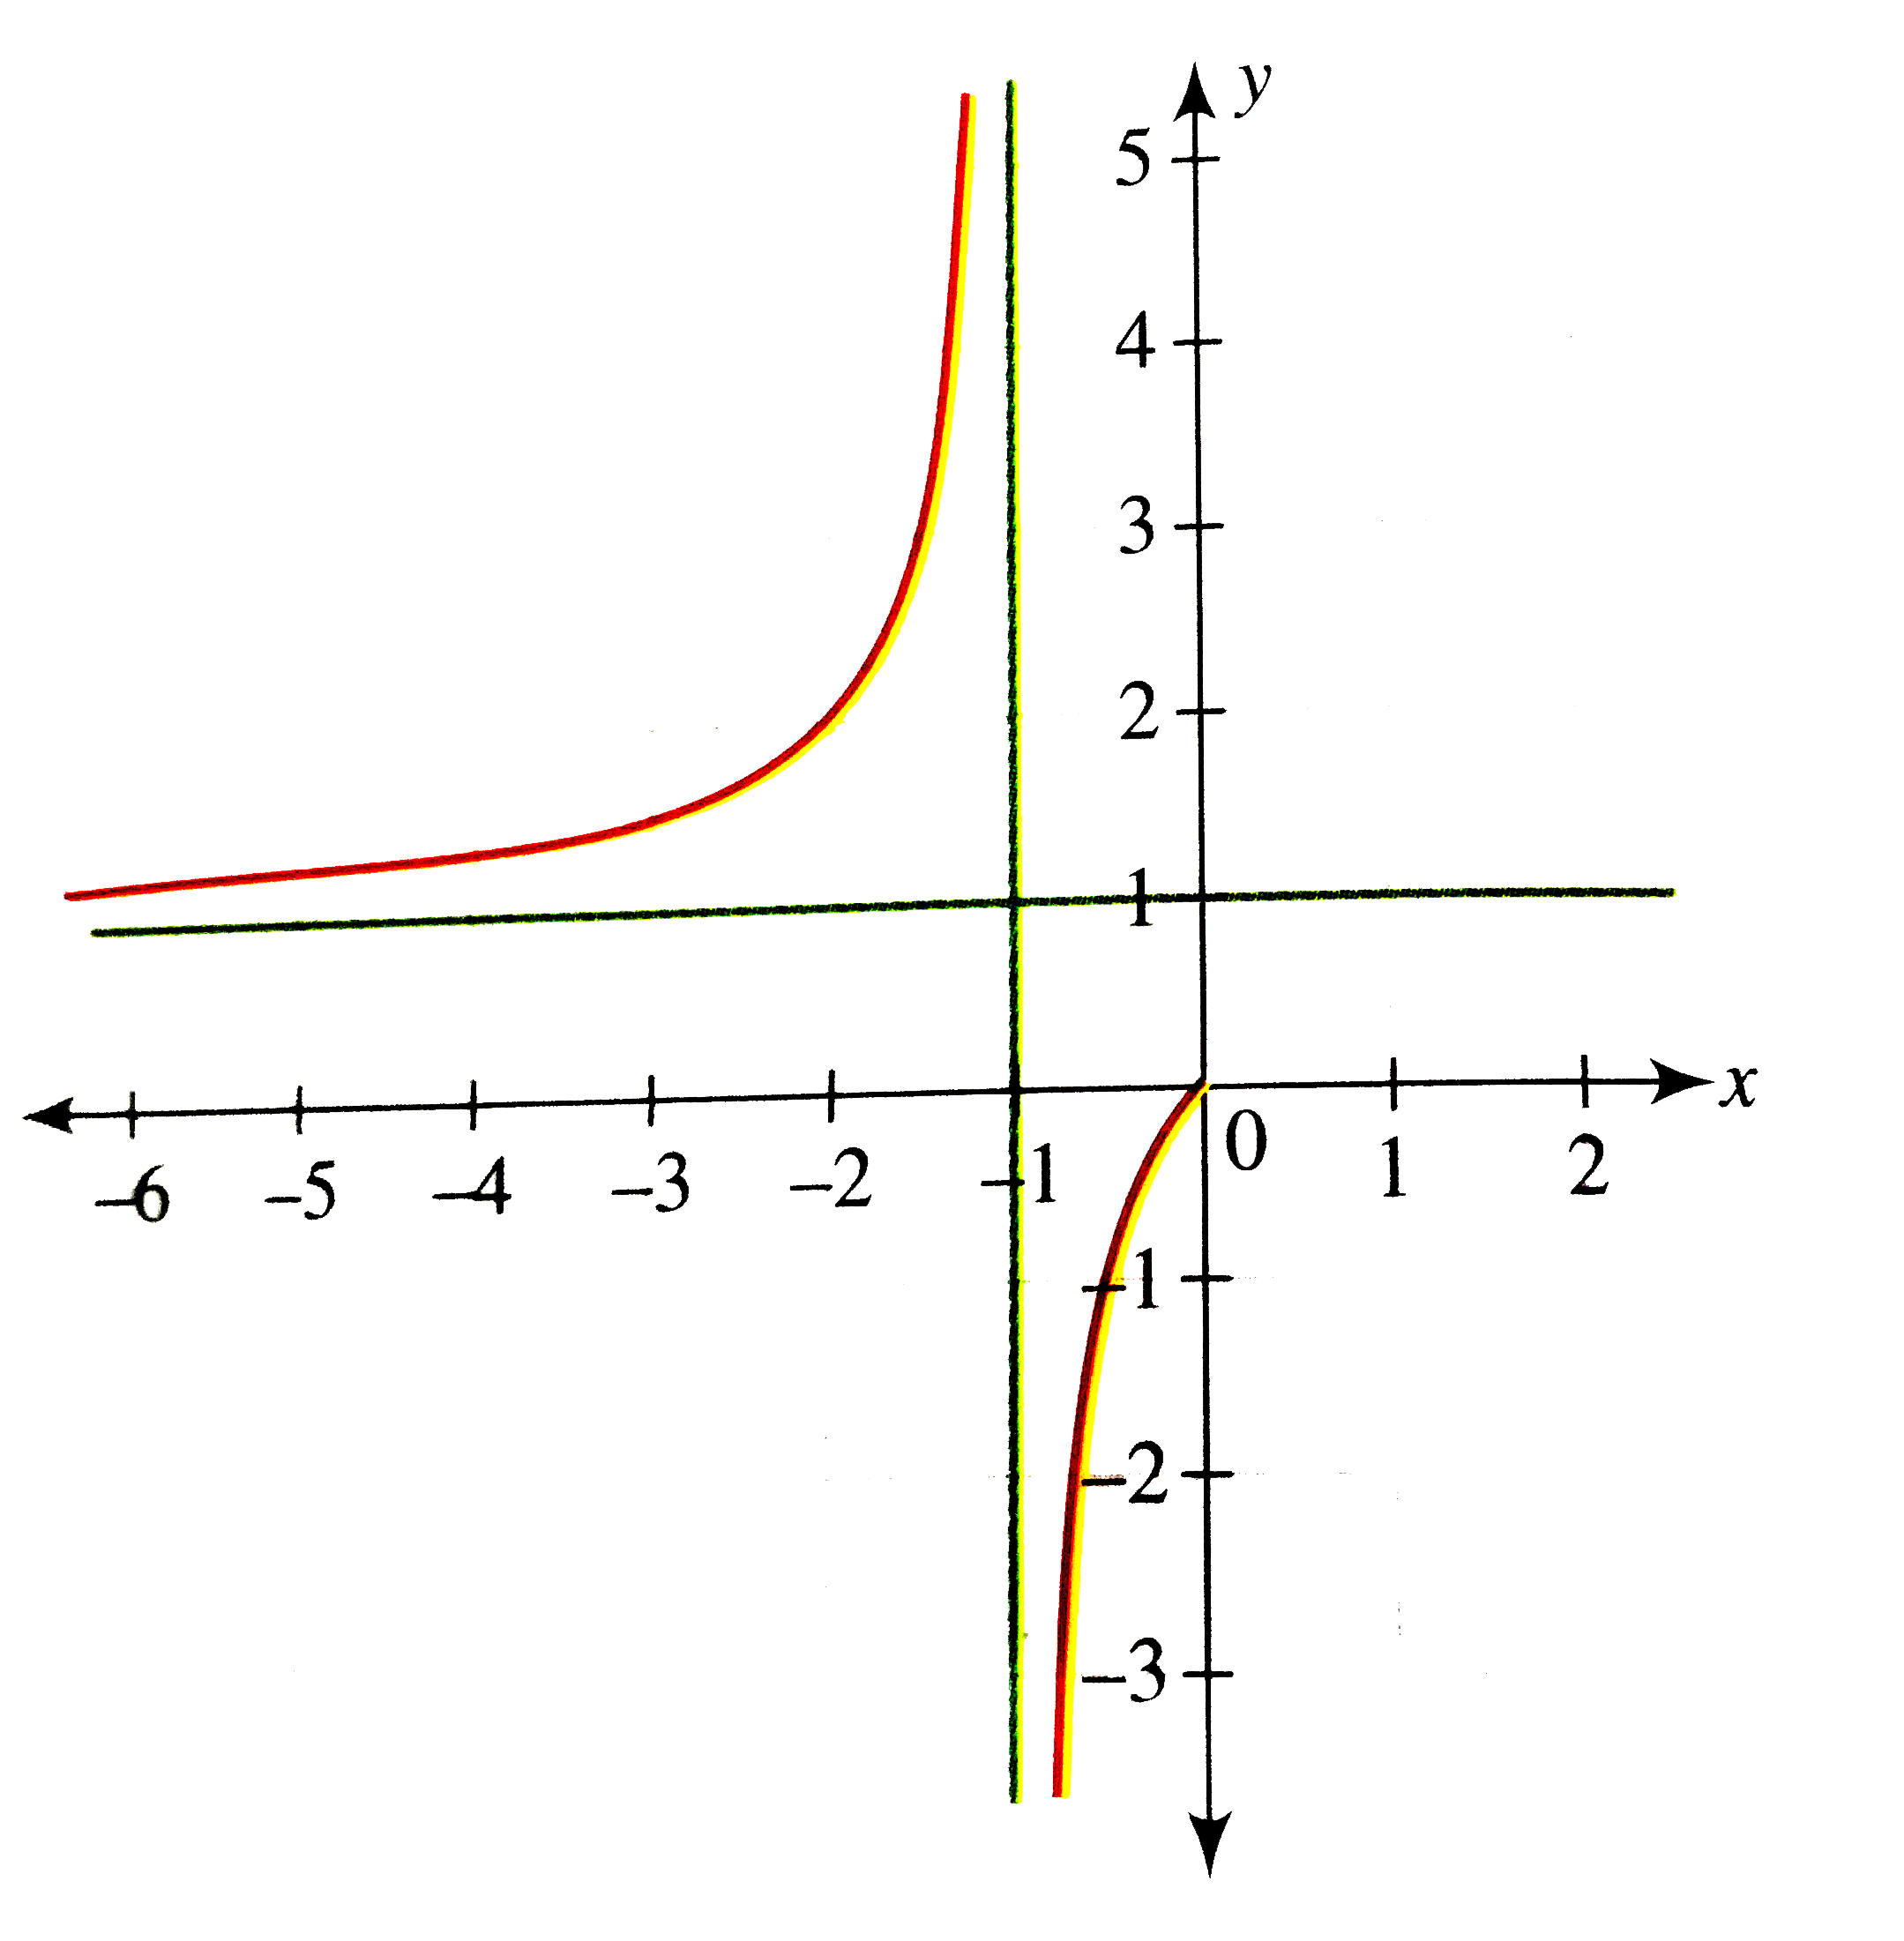
`y=(x)/(1+x)=1-(1)/(1+x)`
So `(y-1)(x+1)=1` , which is a rectangular having centre at (-1,1).
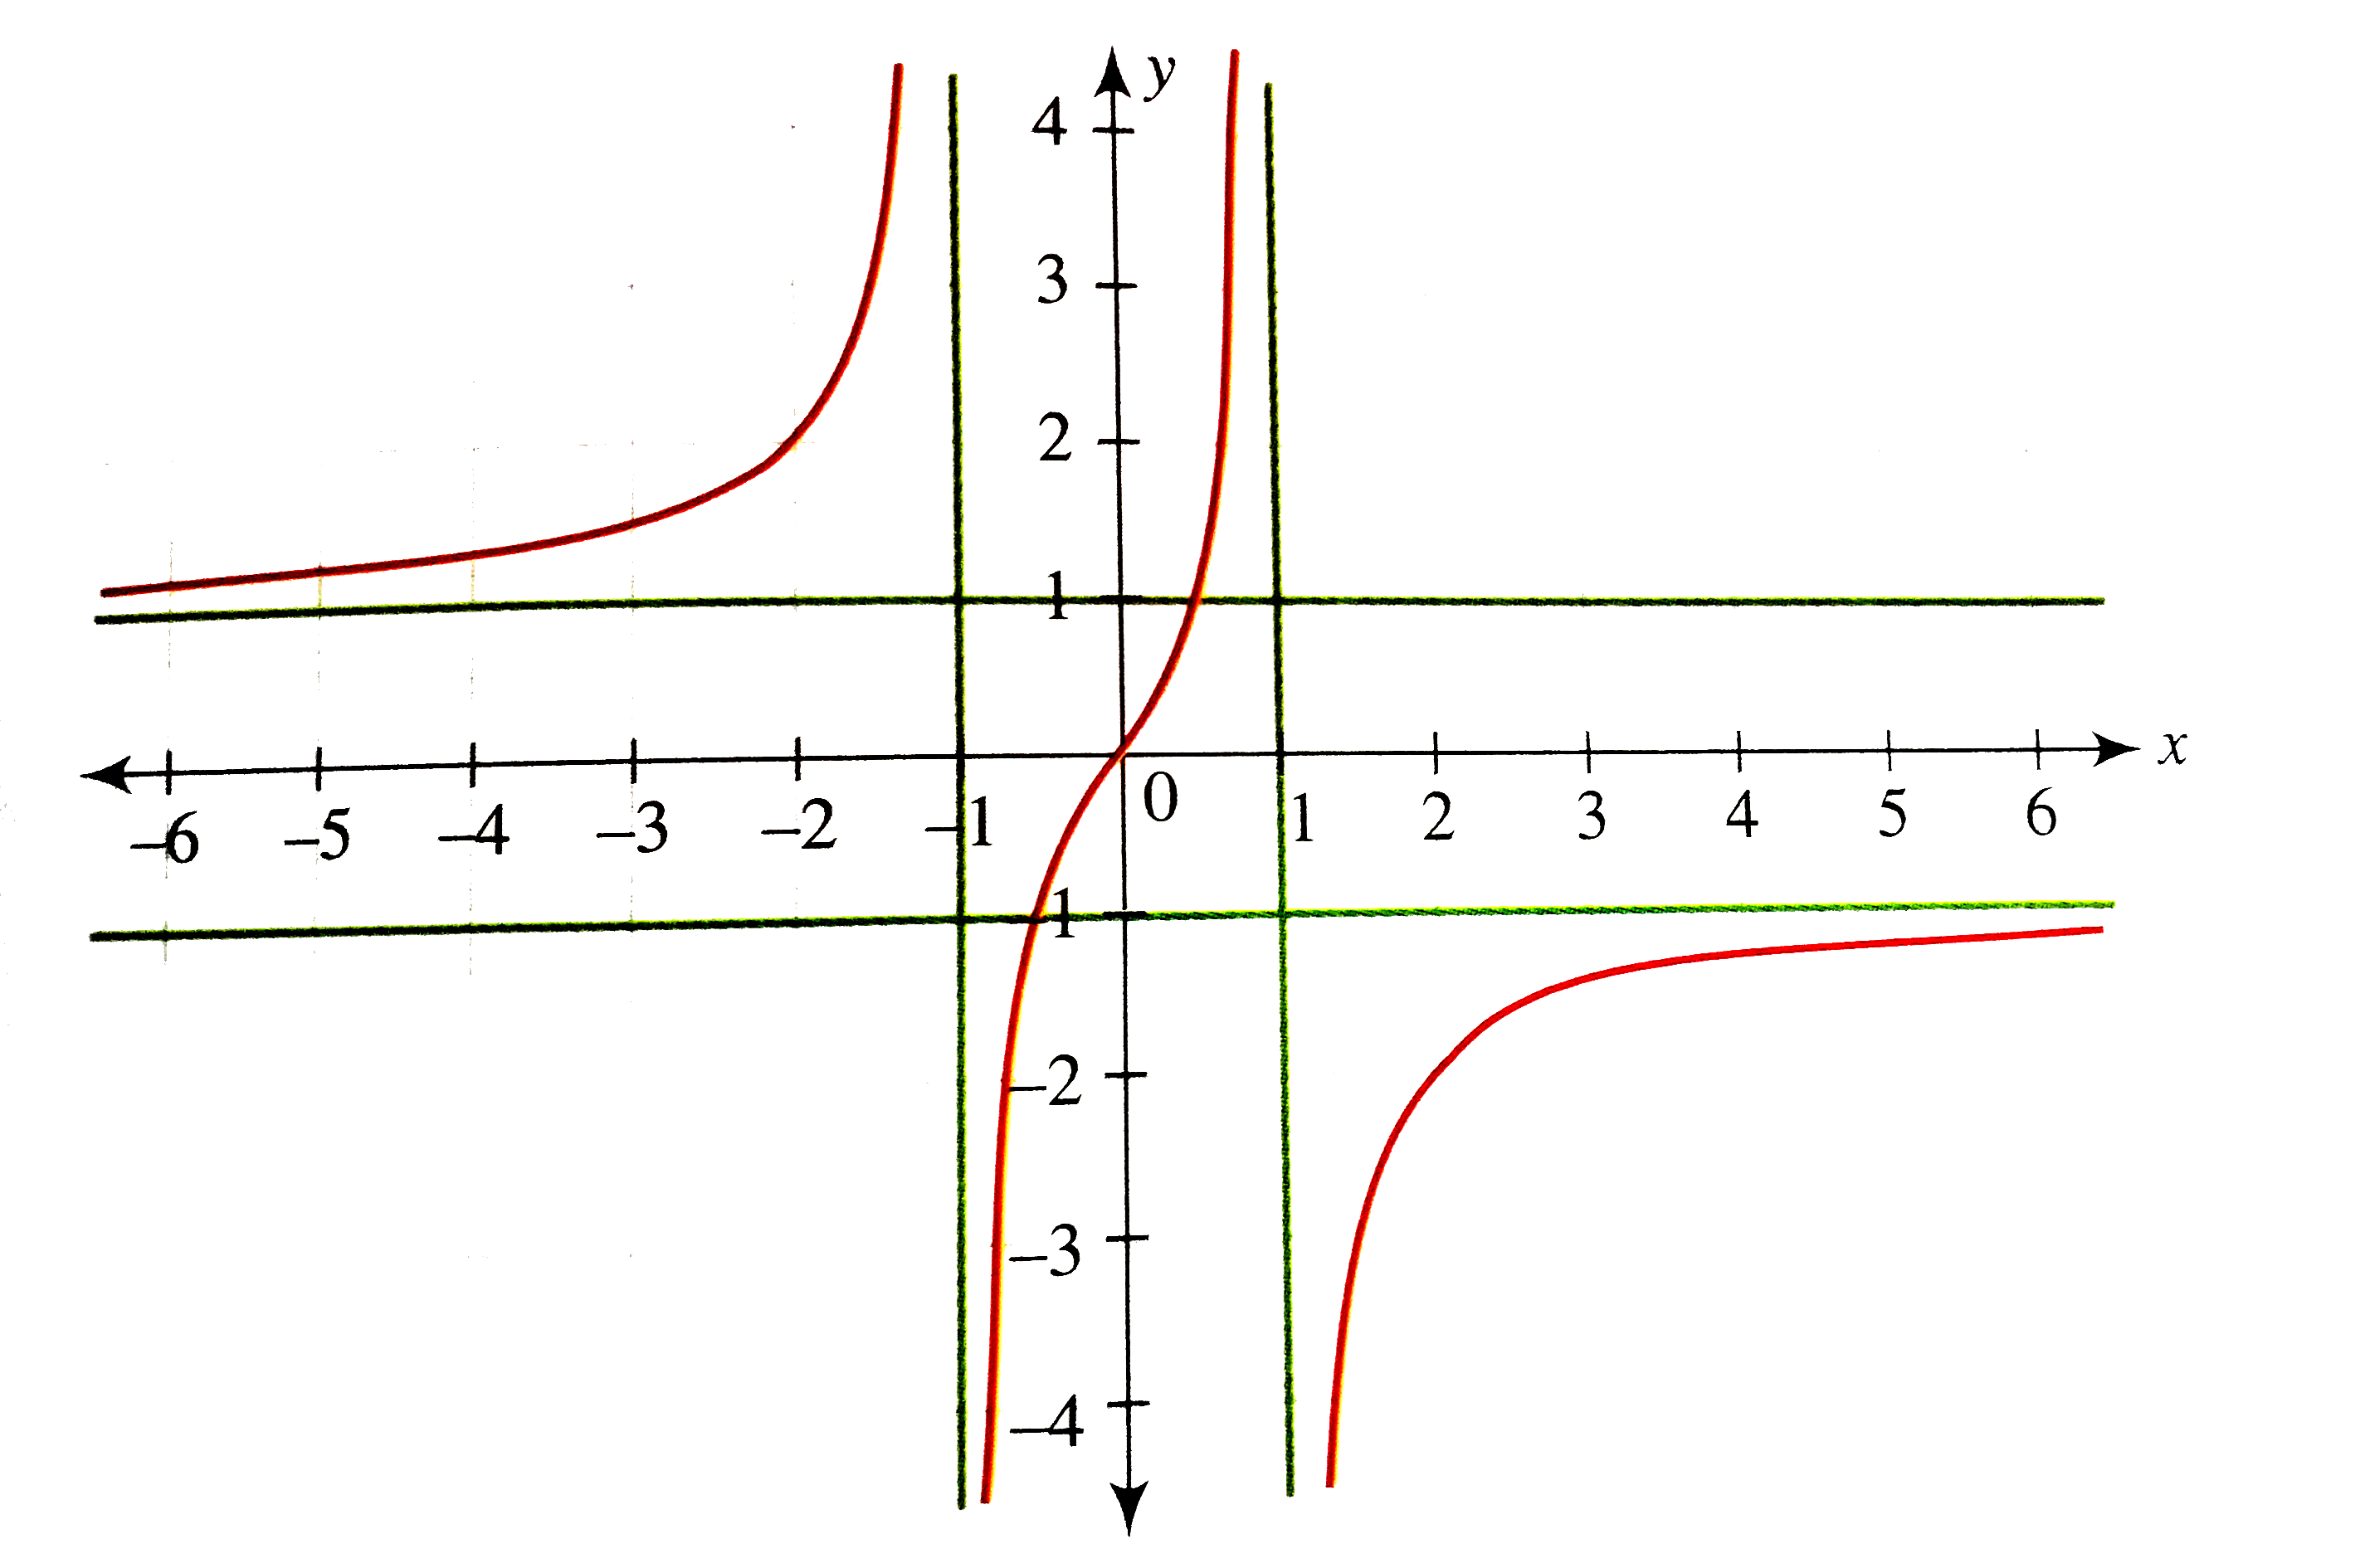
The graph is as shown in the following figure.
Combining two cases, we get the following graph.
Alternative method
`y=f(x)=(x)/(1-|x|)={{:((x)/(1-x)", if " x ge0", " x!=1),((x)/(1+x)", if "xlt0", " x!=-1):}`
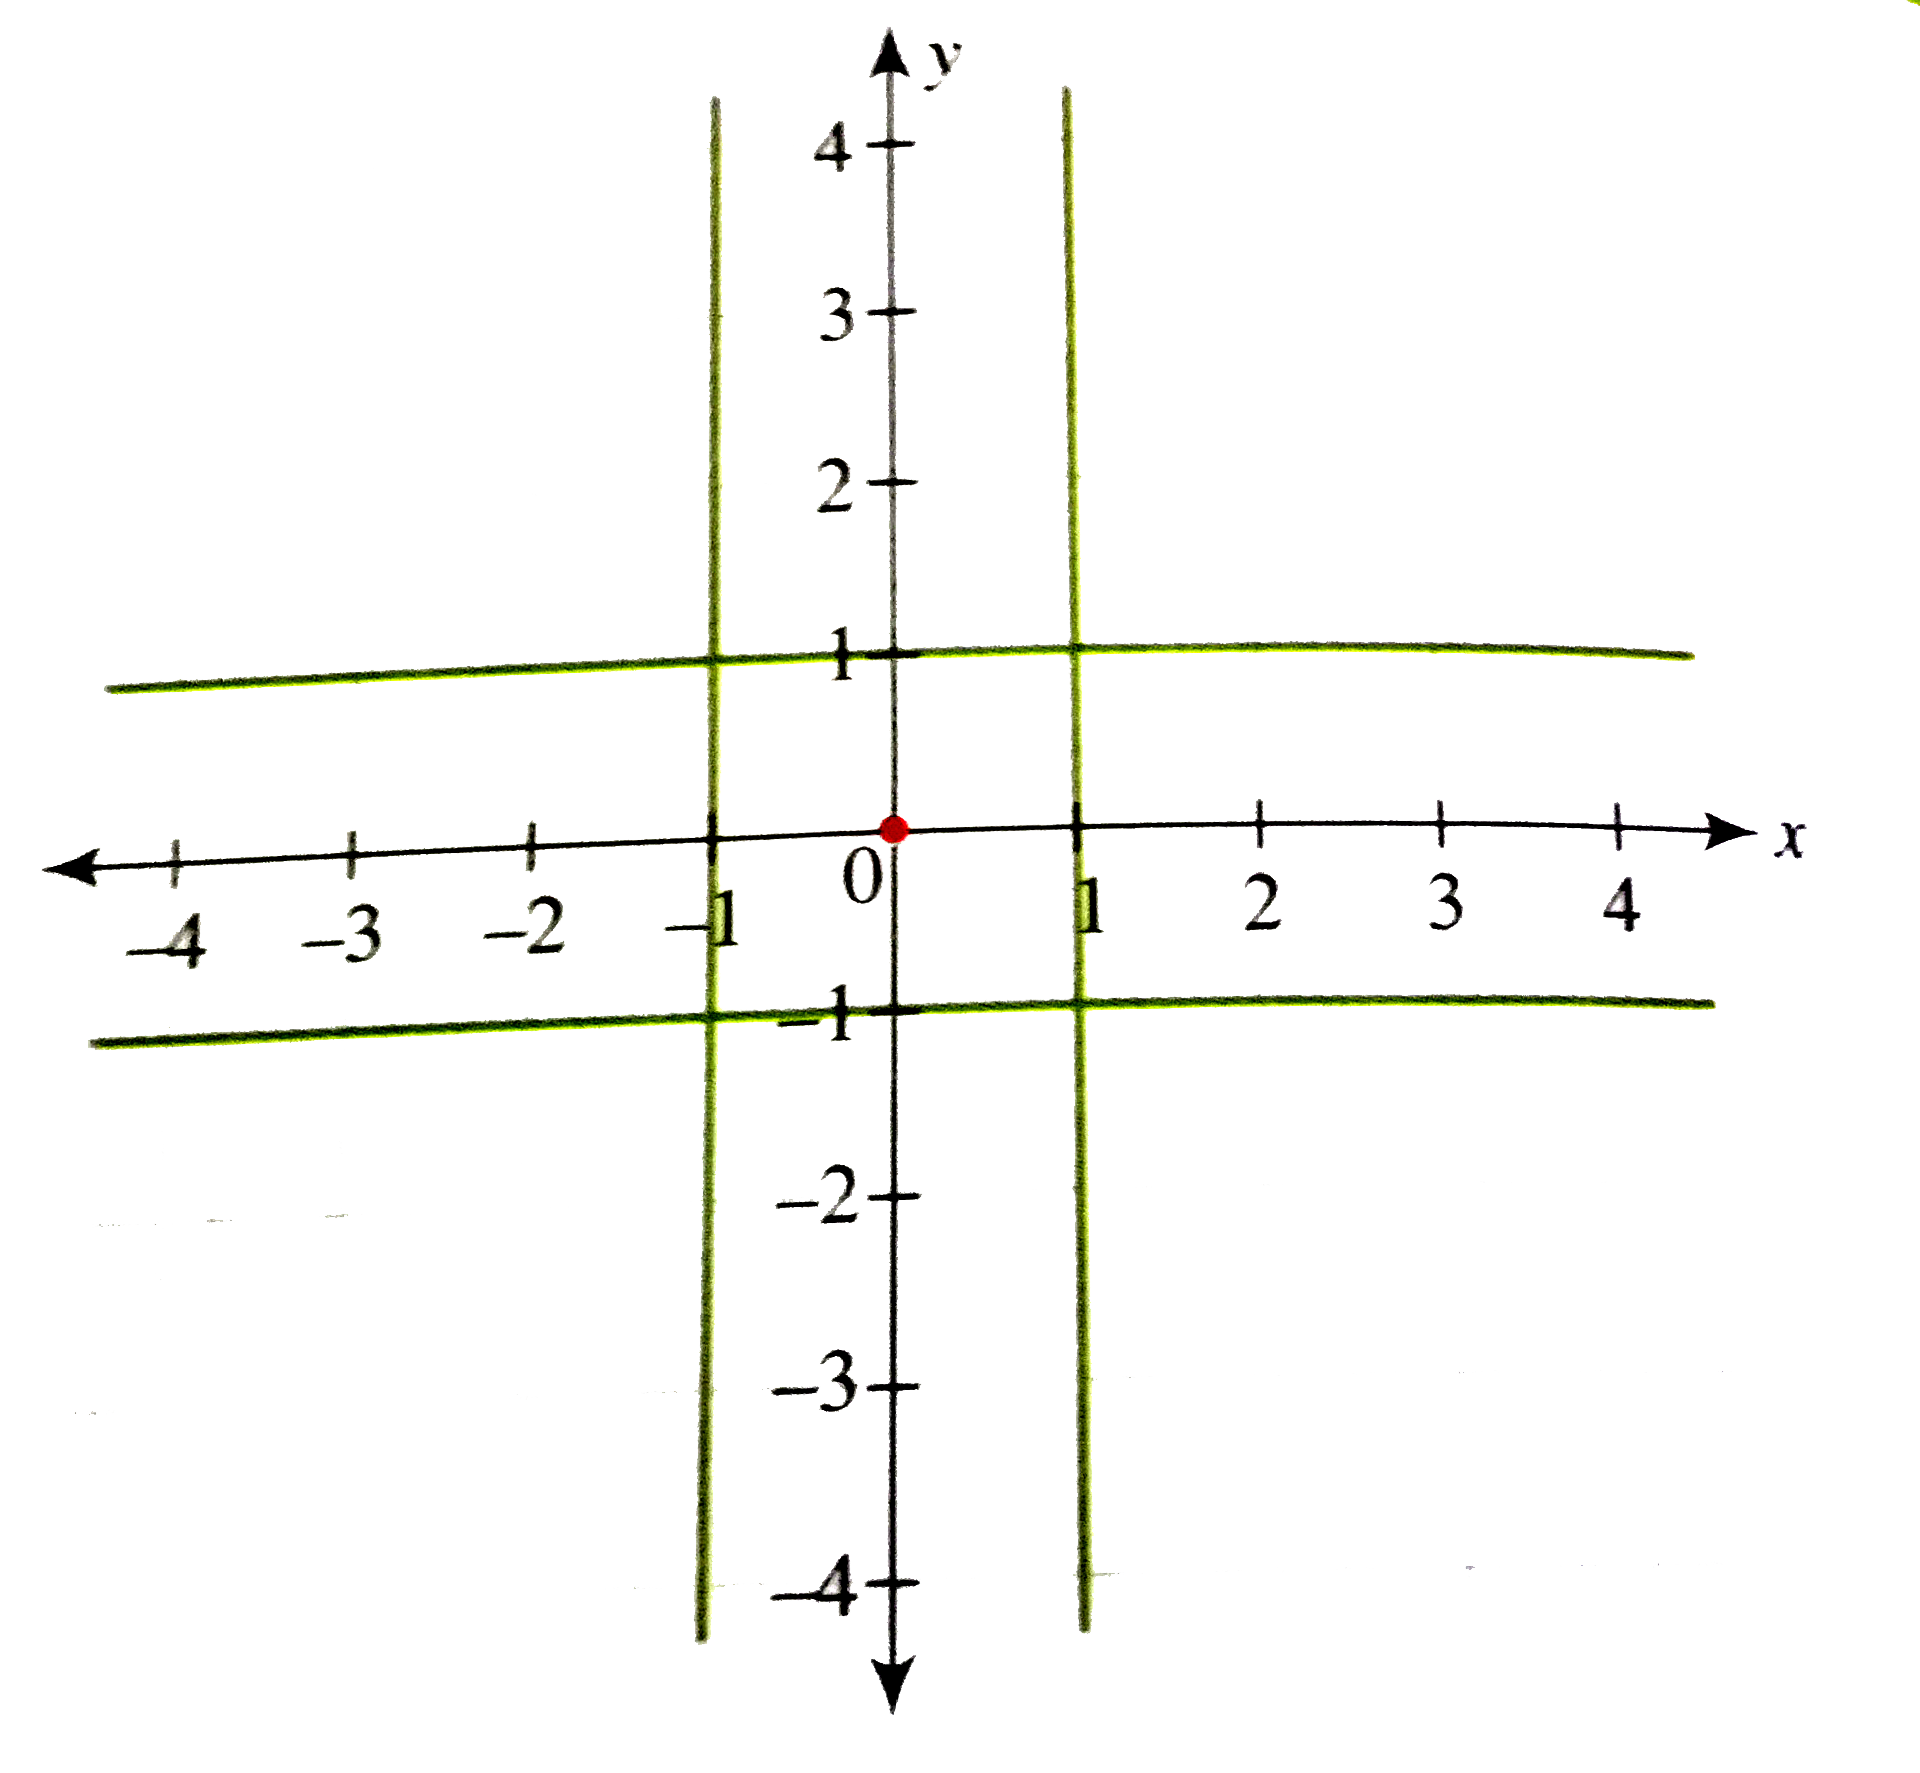
The function has vertical asymptotes as `1-|x|=0, " or " x=+-1`.
Also the function has horizontal asymptotes.
For `xgt0`
`y=underset(xrarroo)lim(x)/(1-x)=underset(xrarroo)lim ((1)/(x))/((1)/(x)-1)=-1`
For `xlt0`
`y=underset(xrarroo)lim(x)/(1+x)=underset(xrarroo)lim ((1)/(x))/((1)/(x)+1)=1`
Graph intersect axis at (0,0)
`f'(x)={{:((1)/((1-x)^(2))", "xgt0", "x!=1),((1)/((1+x)^(2))", " xlt", " x!=-1):}`
`:. " " f'(x) gt 0, AA x in R-{-1,1}`
Hence `f(x)` is an increasing function.
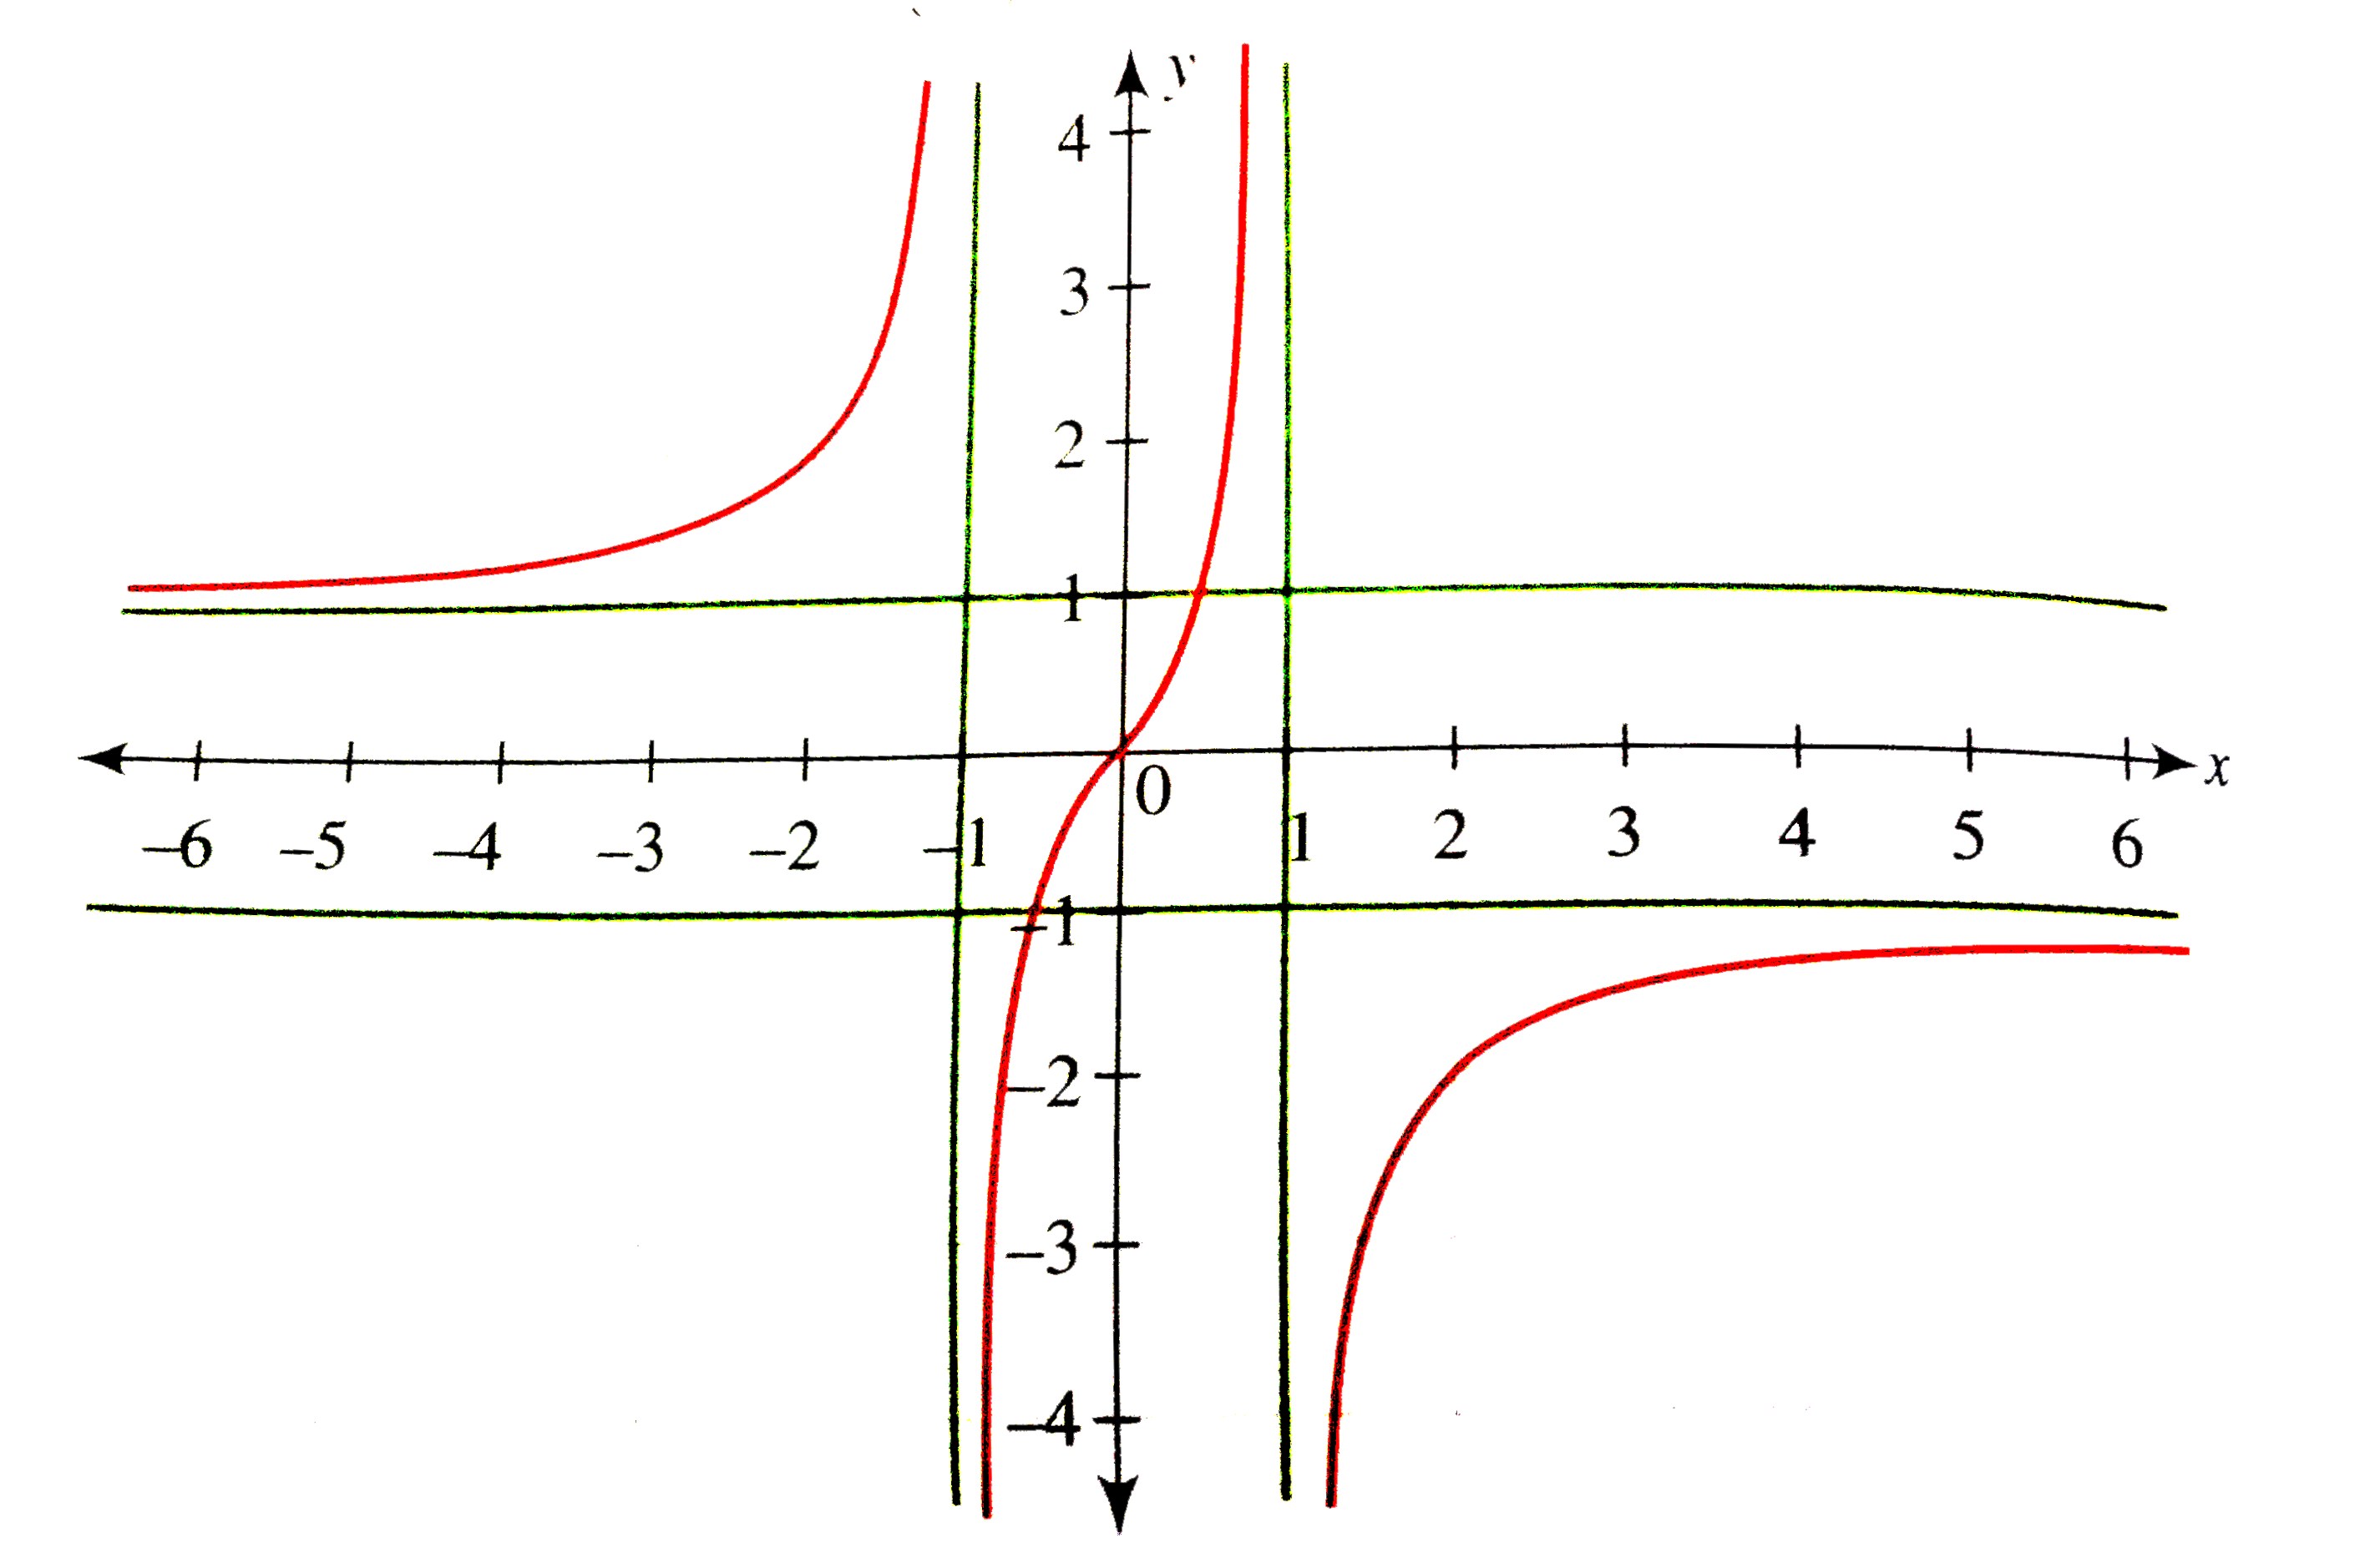
From the above discussion, we have the following reference points and lines.
In the above figure, we have three regions, `x in (-oo,-1),(-1,1),(1,oo)`.
In each region, `f(x)` in increasing.
`underset(xrarr-1^(-))lim (x)/(1-|x|)rarroo`
`underset(xrarr-1^(+))lim (x)/(1-|x|)rarr-oo` and`underset(xrarr1^(-))lim(x)/(1-|x|)rarroo, f(0)=0`
`underset(xrarr1^(+))lim (x)/(1-|x|)rarr -oo` and `underset(xrarroo)lim(x)/(1-|x|)rarr1`
Hence the graph for `x in (-oo,-1) cup(-1,1)cup(1,oo)`is as shown in the following figure.