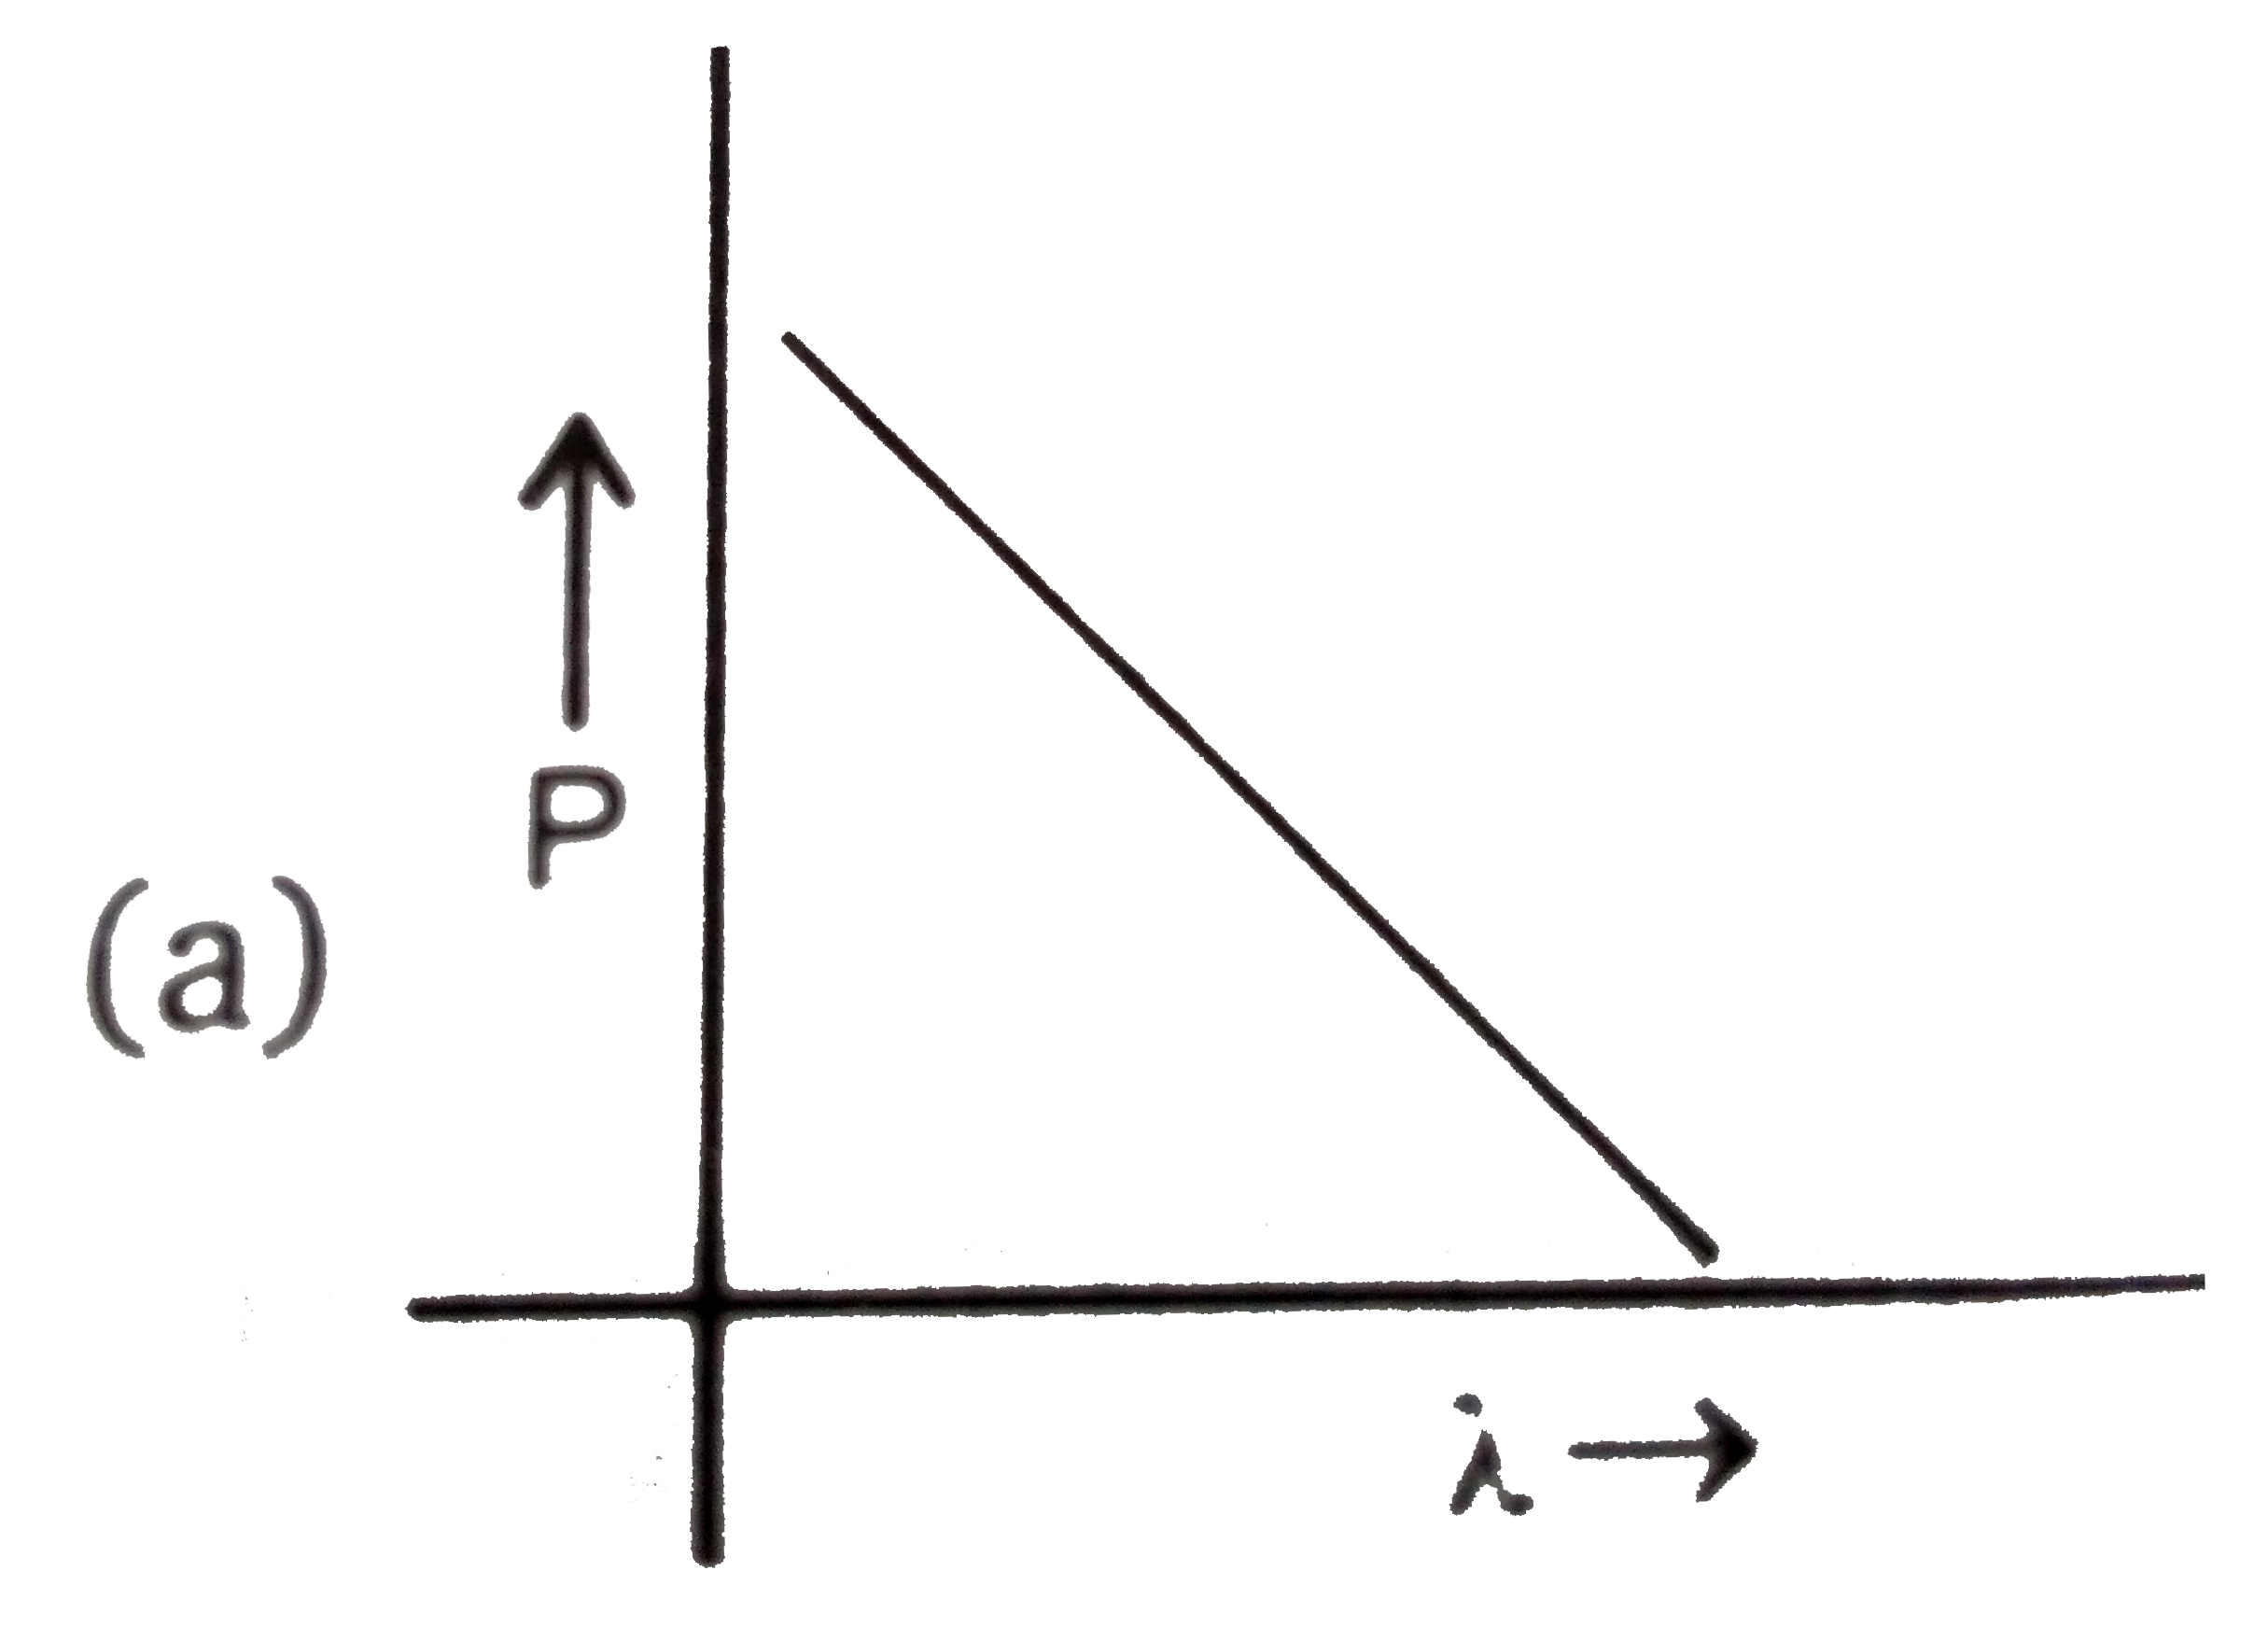
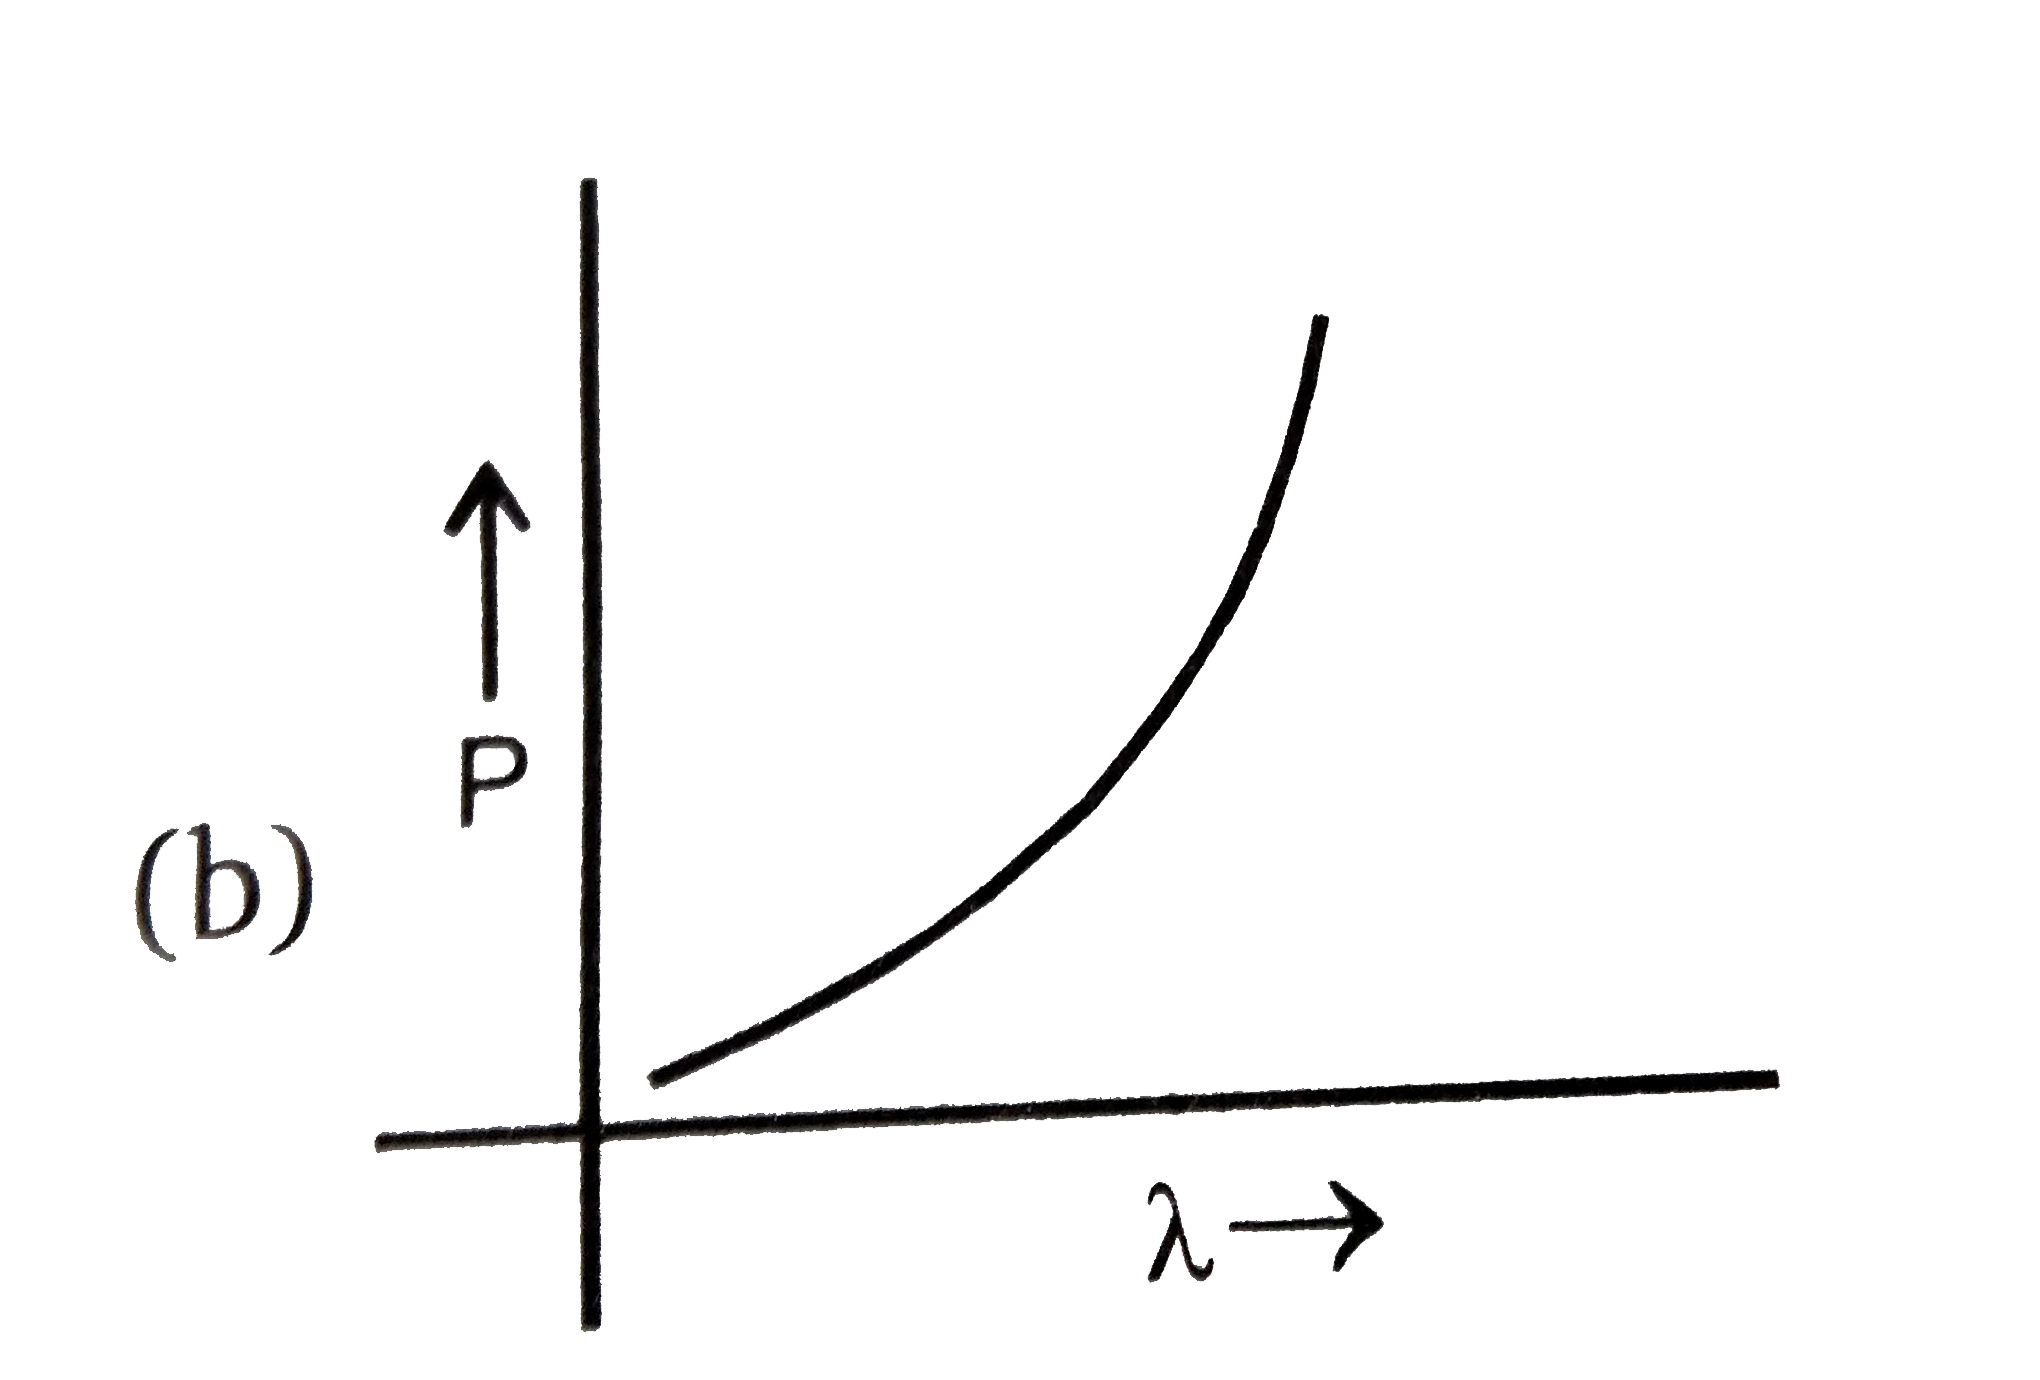
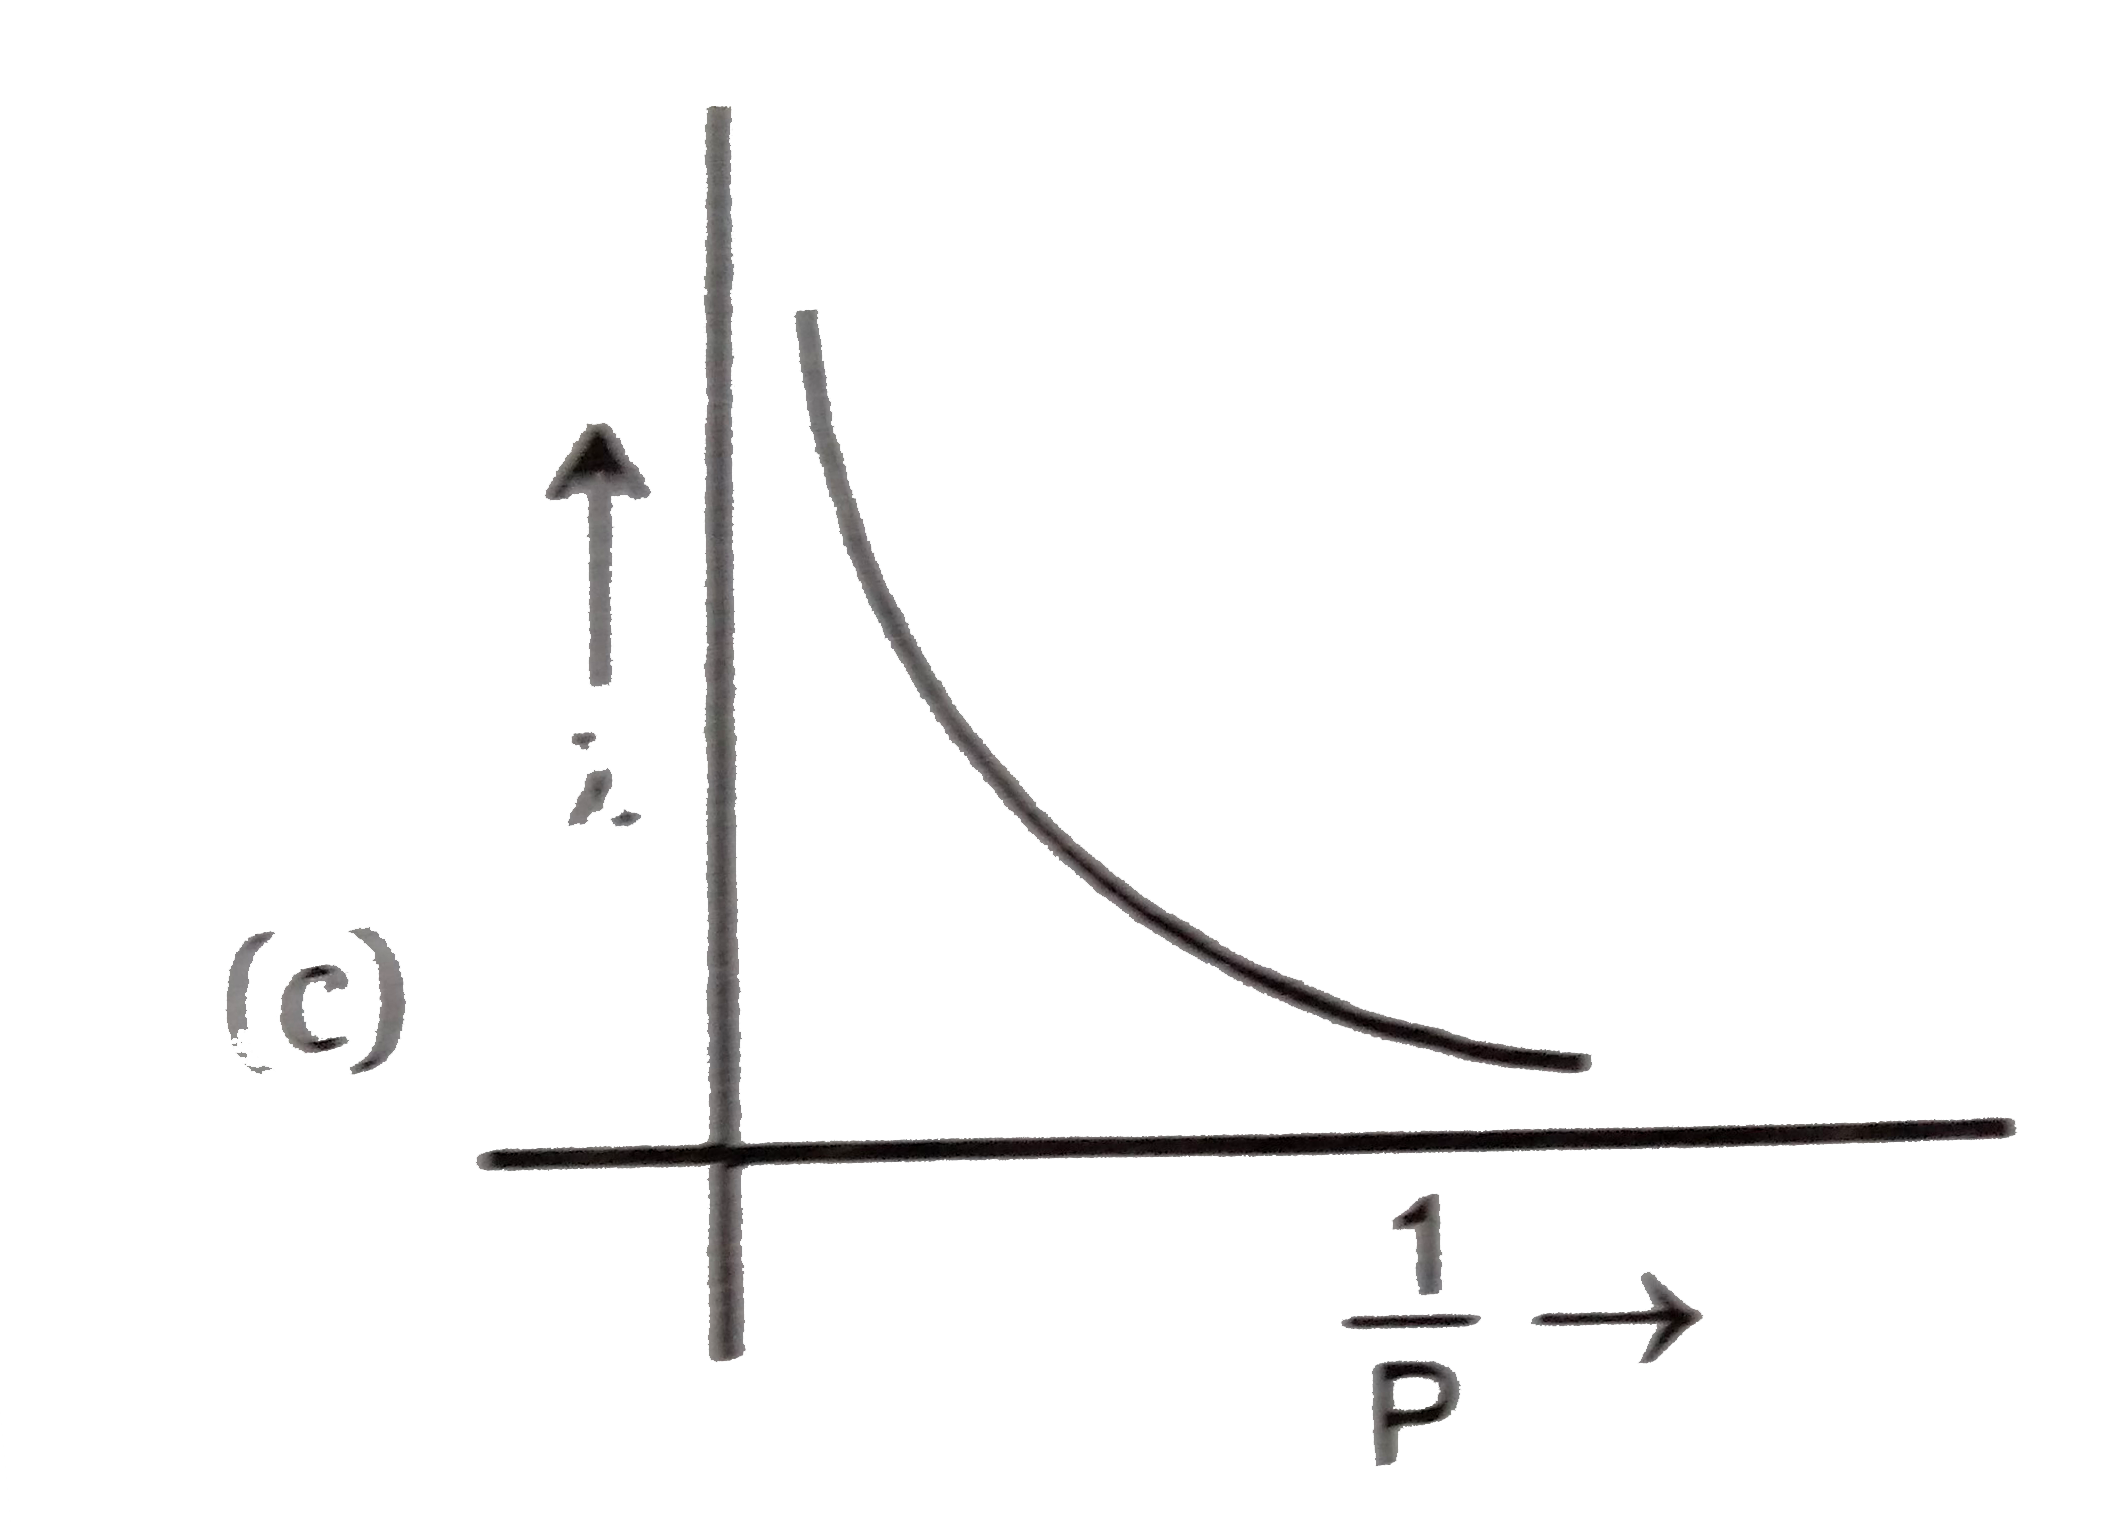
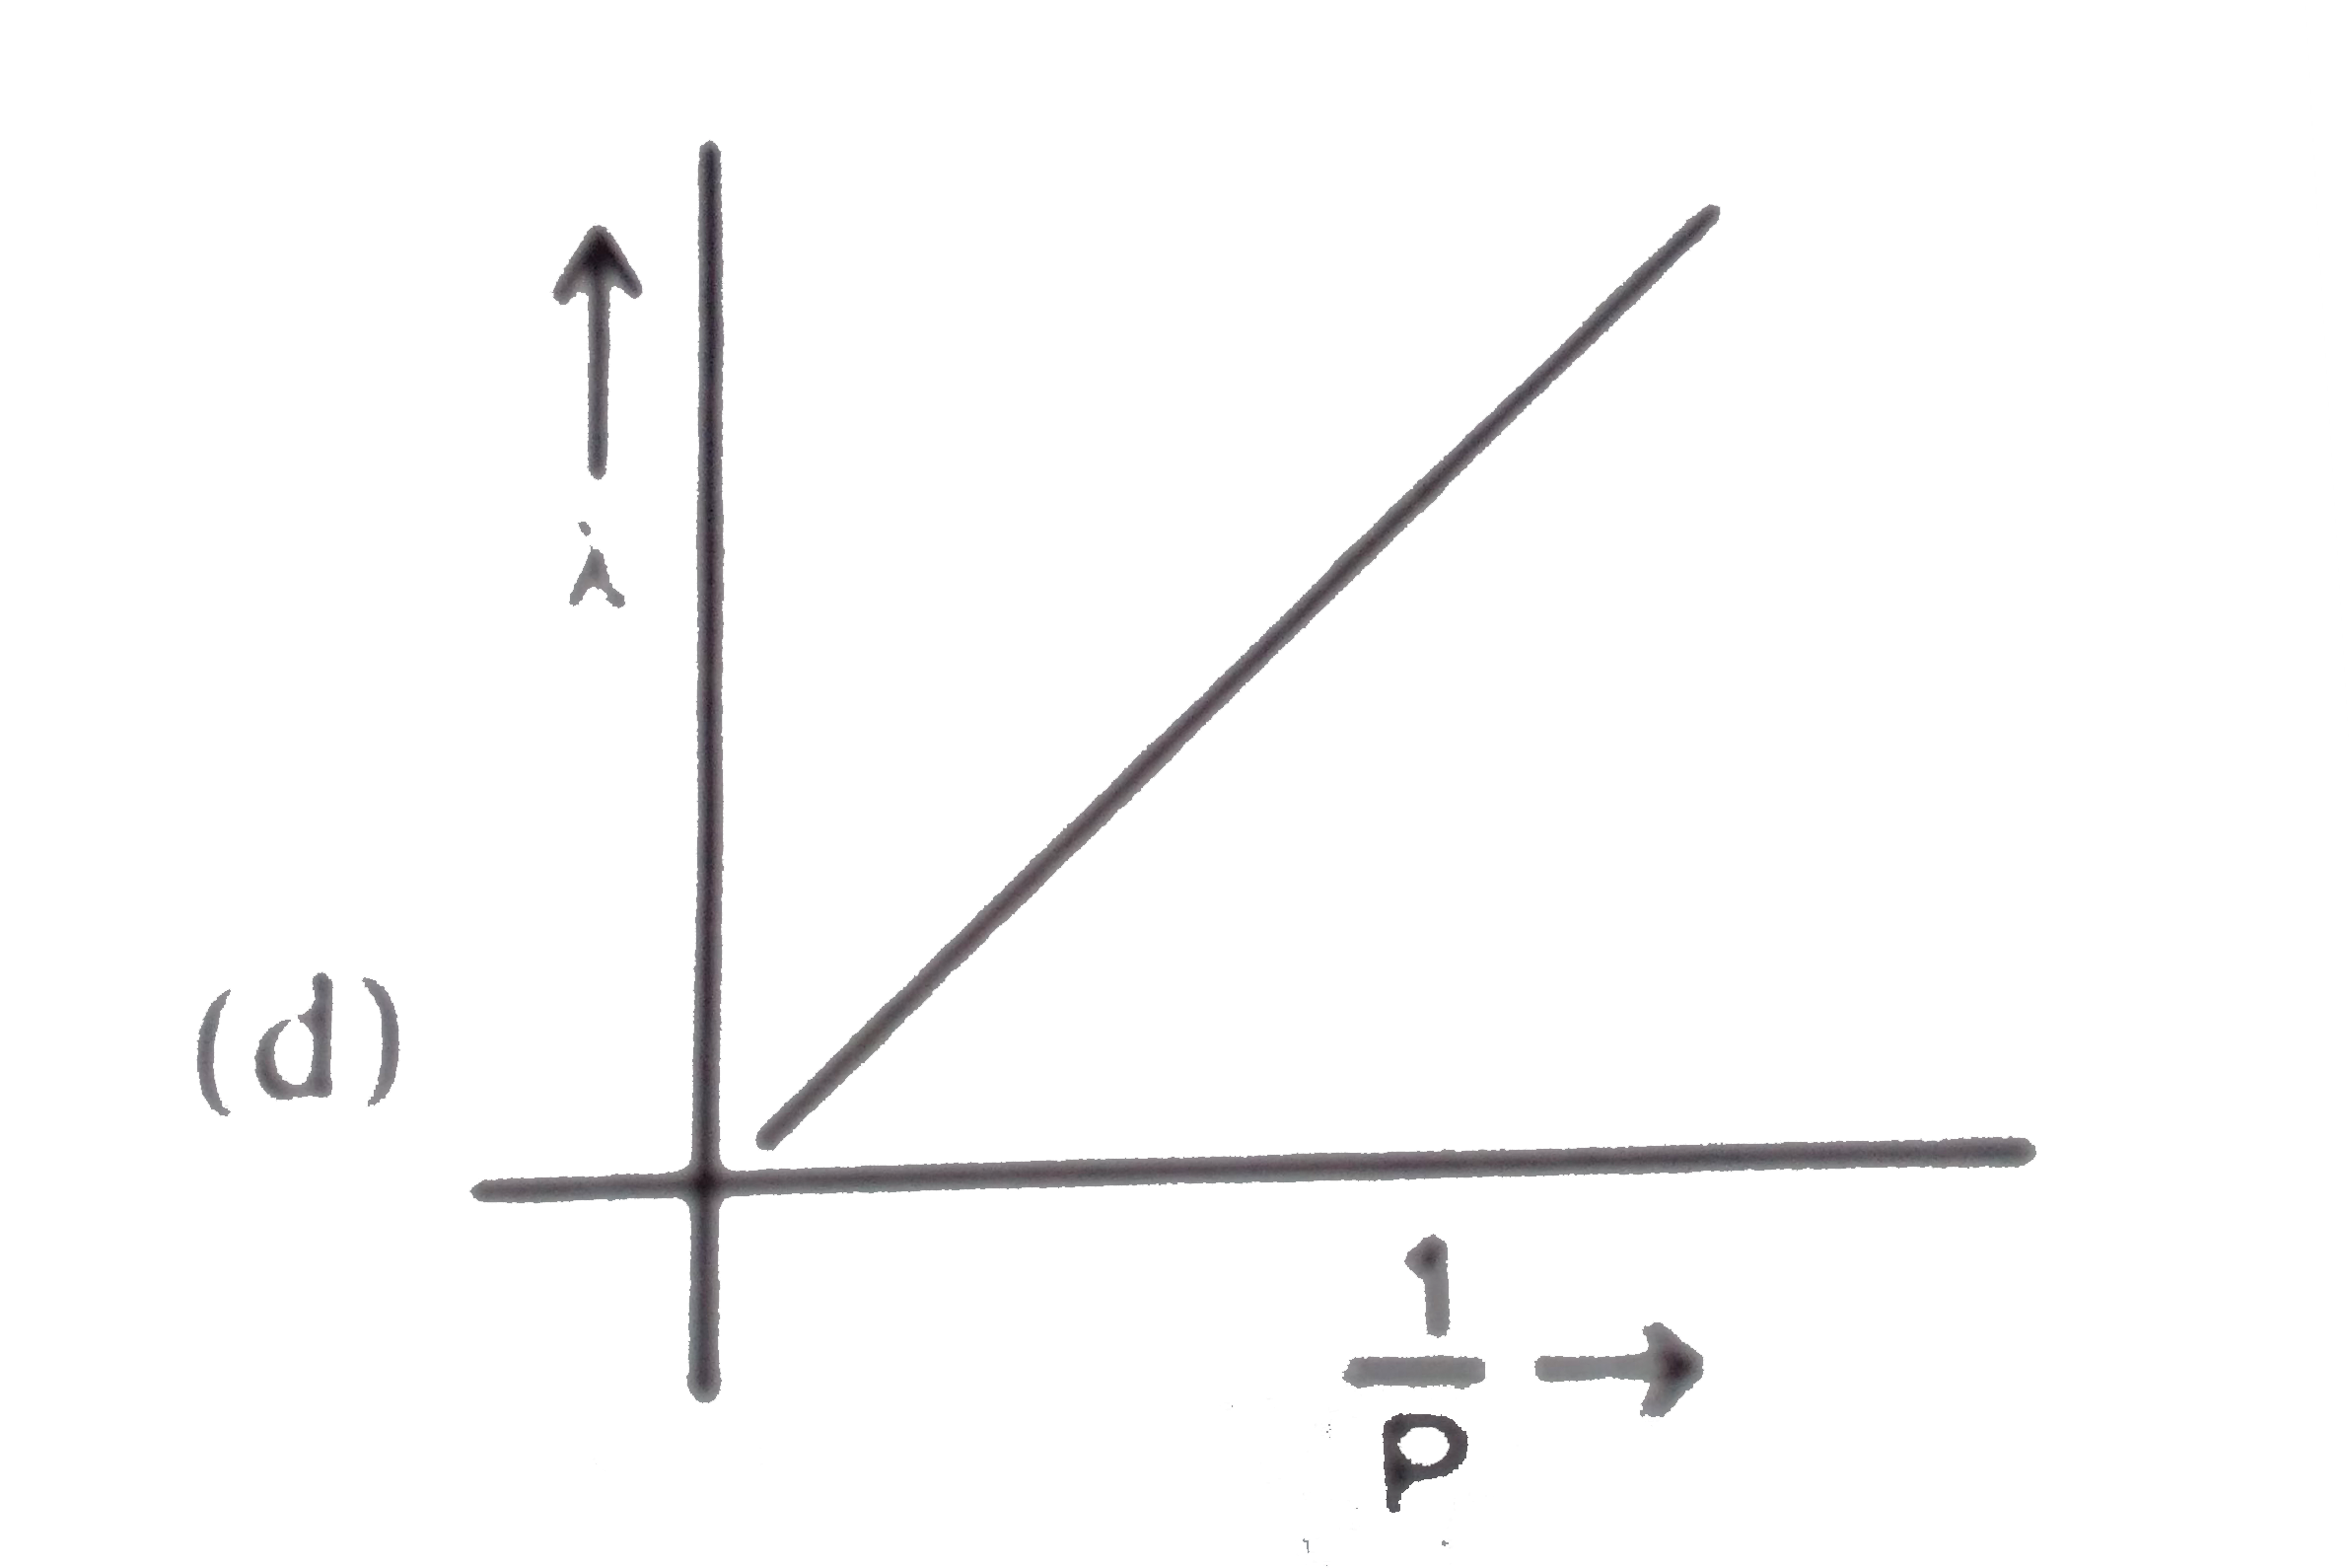
Which of following graphs correctly represents the variation of particle momentum with de-Broglie wavelength?
A
B
C
D
Text Solution
Verified by Experts
Topper's Solved these Questions
ATOMIC STUCTURE
NARENDRA AWASTHI|Exercise Level- 1|1 Videos
ATOMIC STUCTURE
NARENDRA AWASTHI|Exercise level 2|1 Videos
CHEMICAL EQUILIBRIUM
NARENDRA AWASTHI|Exercise Level 2|1 Videos
Similar Questions
Explore conceptually related problems
What is the de Broglie wavelength
Which of the following graphs represents exothermic reaction?
Which of the following graphs represent the function of x ? Why ?
Which of the following represents an infrared wavelength?
Which is the de-Broglie equation?
Calculate the ratio of the accelarating potential required to accelrate a proton and and alpha particle to have the same de-Broglie wavelength associated with them
Which of the following expresson gives the de-Broglie relationship ?
Using bohr's second postaulate of quantisation of orbital angular momentum,show that the circumfernece of the electron in the nth orbital srtate in hydrogen atom is n times the de-Broglie wavelength associated with it.