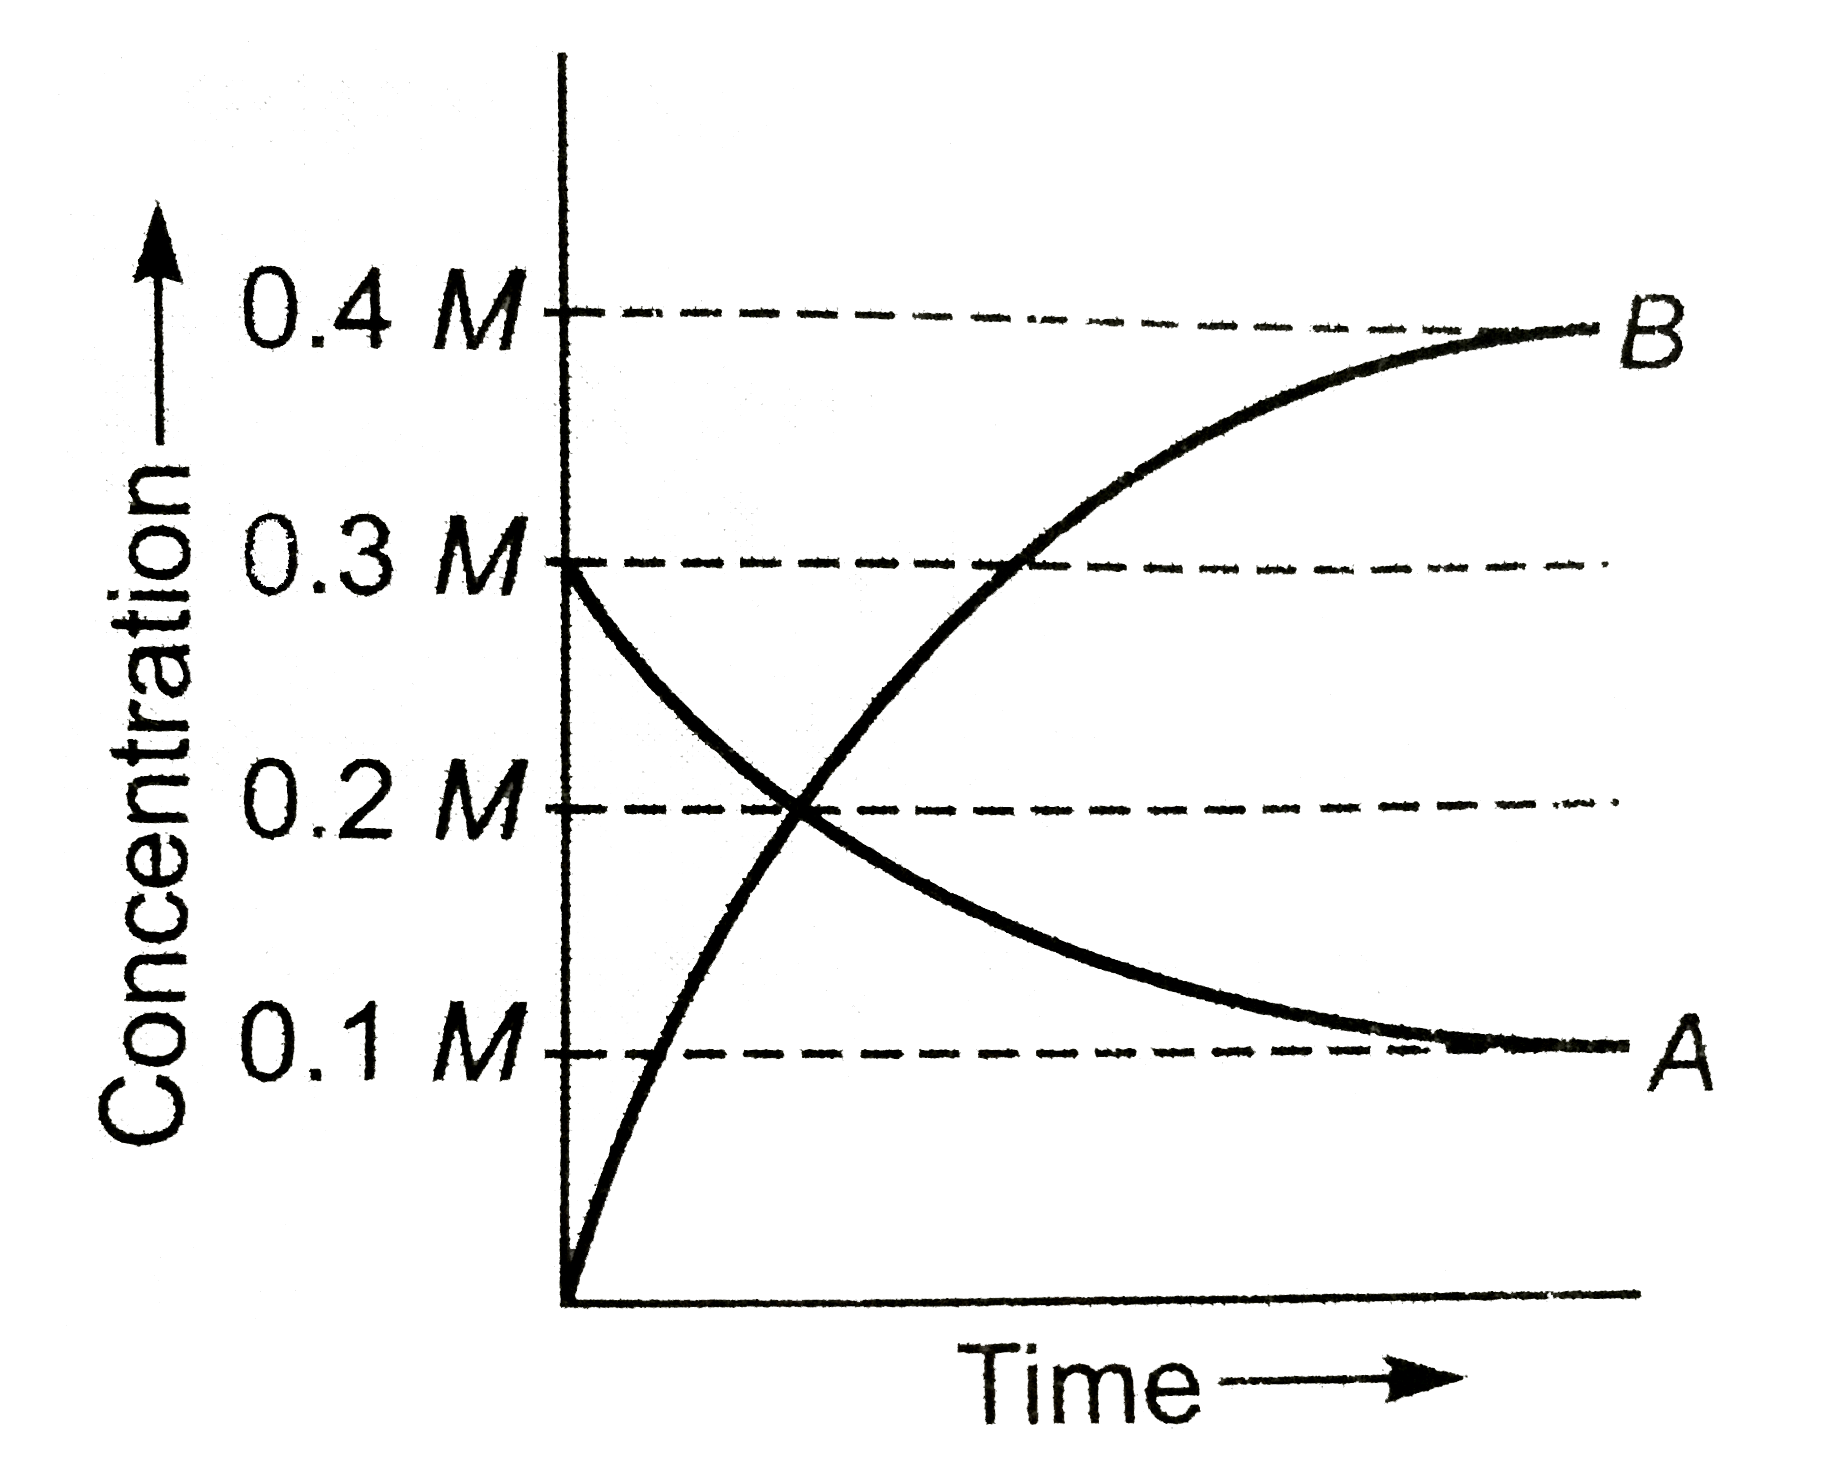
The figure shows the change in concentration of species A and B as a function of time. The equilibrium constant `K_(c)`for the reaction` A(g)hArr2B(g)` is :
A
`K_(c)gt1`
B
`Klt1`
C
`K=1`
D
data insufficient
Text Solution
Verified by Experts
The correct Answer is:
a
Topper's Solved these Questions
CHEMICAL EQUILIBRIUM
NARENDRA AWASTHI|Exercise Level 1 (Q.93 To Q.122)|1 Videos
CHEMICAL EQUILIBRIUM
NARENDRA AWASTHI|Exercise Level 2|1 Videos
ATOMIC STUCTURE
NARENDRA AWASTHI|Exercise level 2|1 Videos
DILUTE SOLUTION
NARENDRA AWASTHI|Exercise Level 3 - Match The Column|1 Videos