


Similar Questions
Explore conceptually related problems
Recommended Questions
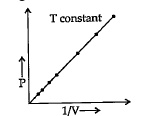
- With the help of graph answer the following At constant temperature ...
Text Solution
|
- Graph shows the relation between Centigrade and Fahrenheit scales of t...
Text Solution
|
- Lother Meyer drew a graph showing the relation between
Text Solution
|
- Graph between pressure and volume are plotted at different temperature...
Text Solution
|
- A graph is plotted between pressure and volume at different temperatur...
Text Solution
|
- Pressure vs volume graph at constant temperature is known as…………….
Text Solution
|
- At constant pressure, the temperature coefficient of volume expansion ...
Text Solution
|
- Which of the following shows correct relation between volume and tempe...
Text Solution
|
- A graph is plotted between pressure and volume at different temperatur...
Text Solution
|