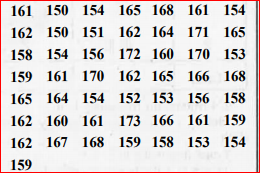
 : What can you conclude about their heights from the table ?


Topper's Solved these Questions
Similar Questions
Explore conceptually related problems
MBD-STATISTICS-EXERCISE
- The heights of 50 students, measured to the nearest centimetres have b...
Text Solution
|
- The weights (in kg) of 30 students of a class are 49, 48, 46, 48, 48, ...
Text Solution
|
- The weights (in kg) of 30 students of a class are 49, 48, 46, 48, 48, ...
Text Solution
|
- The weights (in kg) of 30 students of a class are 49, 48, 46, 48, 48, ...
Text Solution
|
- The weights (in kg) of 30 students of a class are 49, 48, 46, 48, 48, ...
Text Solution
|
- Construct a grouped frequency table with class intervals 0-5, 5 -10 an...
Text Solution
|
- Construct a grouped frequency table with class intervals 0-5, 5 -10 an...
Text Solution
|
- Pulse rate (per miute) of 30 persons were recorded as 61,76,72,73,71,...
Text Solution
|
- Pulse rate (per miute) of 30 persons were recorded as 61,76,72,73,71,...
Text Solution
|
- Pulse rate (per miute) of 30 persons were recorded as 61,76,72,73,71,...
Text Solution
|
- Pulse rate (per miute) of 30 persons were recorded as 61,76,72,73,71,...
Text Solution
|
- A family with monthly income of Rs. 20,000 had planned the following e...
Text Solution
|
- Consider the following frequency distribution table representing the w...
Text Solution
|
- The following distribution gives the time taken by 25 students to solv...
Text Solution
|
- The following table presents the number of literate females in the age...
Text Solution
|
- For the following data, draw a frequency polygon .
Text Solution
|
- In a city, the following weekly observations were made in a study on c...
Text Solution
|
- The following table gives the distribution of IQ (intelligence Quotien...
Text Solution
|
- A teacher wanted to analyse the performance of two sections of student...
Text Solution
|
- The mean of 96, 98, x, 102, 104 is 100, find x.
Text Solution
|
- Find the mean of all possible factors of 20.
Text Solution
|