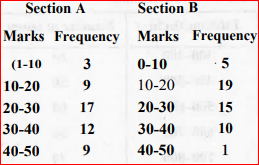
 : Represent the marks of the students of both the sections on the same graph by two frequency polygons. From the two polygons compare the performance of the twosections.


Topper's Solved these Questions
Similar Questions
Explore conceptually related problems
MBD-STATISTICS-EXERCISE
- The following table gives the distribution of students of two sections...
Text Solution
|
- The weights (in kg) of 30 students of a class are 49, 48, 46, 48, 48, ...
Text Solution
|
- The weights (in kg) of 30 students of a class are 49, 48, 46, 48, 48, ...
Text Solution
|
- The weights (in kg) of 30 students of a class are 49, 48, 46, 48, 48, ...
Text Solution
|
- The weights (in kg) of 30 students of a class are 49, 48, 46, 48, 48, ...
Text Solution
|
- Construct a grouped frequency table with class intervals 0-5, 5 -10 an...
Text Solution
|
- Construct a grouped frequency table with class intervals 0-5, 5 -10 an...
Text Solution
|
- Pulse rate (per miute) of 30 persons were recorded as 61,76,72,73,71,...
Text Solution
|
- Pulse rate (per miute) of 30 persons were recorded as 61,76,72,73,71,...
Text Solution
|
- Pulse rate (per miute) of 30 persons were recorded as 61,76,72,73,71,...
Text Solution
|
- Pulse rate (per miute) of 30 persons were recorded as 61,76,72,73,71,...
Text Solution
|
- A family with monthly income of Rs. 20,000 had planned the following e...
Text Solution
|
- Consider the following frequency distribution table representing the w...
Text Solution
|
- The following distribution gives the time taken by 25 students to solv...
Text Solution
|
- The following table presents the number of literate females in the age...
Text Solution
|
- For the following data, draw a frequency polygon .
Text Solution
|
- In a city, the following weekly observations were made in a study on c...
Text Solution
|
- The following table gives the distribution of IQ (intelligence Quotien...
Text Solution
|
- A teacher wanted to analyse the performance of two sections of student...
Text Solution
|
- The mean of 96, 98, x, 102, 104 is 100, find x.
Text Solution
|
- Find the mean of all possible factors of 20.
Text Solution
|