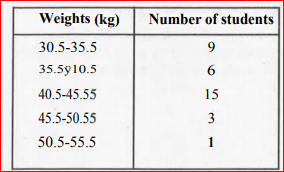
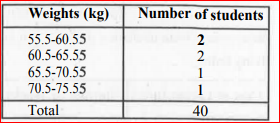
 Draw a histogram to represent the above data.


Topper's Solved these Questions
Similar Questions
Explore conceptually related problems
MBD-STATISTICS-EXERCISE
- Pulse rate (per miute) of 30 persons were recorded as 61,76,72,73,71,...
Text Solution
|
- A family with monthly income of Rs. 20,000 had planned the following e...
Text Solution
|
- Consider the following frequency distribution table representing the w...
Text Solution
|
- The following distribution gives the time taken by 25 students to solv...
Text Solution
|
- The following table presents the number of literate females in the age...
Text Solution
|
- For the following data, draw a frequency polygon .
Text Solution
|
- In a city, the following weekly observations were made in a study on c...
Text Solution
|
- The following table gives the distribution of IQ (intelligence Quotien...
Text Solution
|
- A teacher wanted to analyse the performance of two sections of student...
Text Solution
|
- The mean of 96, 98, x, 102, 104 is 100, find x.
Text Solution
|
- Find the mean of all possible factors of 20.
Text Solution
|
- Find the mean of 25, 27, 19, 29, 21, 23, 25, 30, 28, 20 and prove that...
Text Solution
|
- Let m be the mid-point and l be the upper class limit of a class in a ...
Text Solution
|
- The class marks of a frequency distribution are given as follows : 15,...
Text Solution
|
- In the class intervals 10-20, 20-30, the number 20 is included in.
Text Solution
|
- A grouped frequency table with class intervals of equal sizes using 25...
Text Solution
|
- A grouped frequency distribution table with classes of equal sizes usi...
Text Solution
|
- To draw a histogram to represent the following frequency ditribution :...
Text Solution
|
- The mean of five numbers is 30. If one number is excluded, their mean ...
Text Solution
|
- If the mean of the observations : x, x + 3, x + 5, x + 7, x + 10 is 9,...
Text Solution
|