Home
Class 9
MATHS
The following table gives the distributi...

The following table gives the distribution of IQ (intelligence Quotient) of 60 pupils of class IX in a school
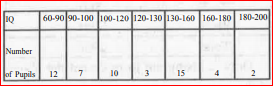
Draw a histrogram to represent the above data.

Promotional Banner

Topper's Solved these Questions

Similar Questions

Explore conceptually related problems

Consider the following frequency distribution table representing the weights of 40 students of a class . Draw a histogram to represent the above data.

The following distribution gives the time taken by 25 students to solve a problem. Draw a histogram to represent the above Data.

The following table presents the number of literate males in a town: Draw a histogram to represent the above data.

The following table shows the number of illiterate persons in the age group in a town Draw a histogram to represent the above data.

The following table gives the number of students in IX class in a school during the academic years 2012-2013 to 2016-17 Represent the above data by a bar graph.

The following table gives the distribution of students of two sections according to the marks obtained by them : : Represent the marks of the students of both the sections on the same graph by two frequency polygons. From the two polygons compare the performance of the twosections.

Various modes of transport used by 1950 students of a school are given below Draw a graph to represent the above data.

The following table presents the number of literate females in the age group (10-34) in town. Draw a histogram to represent the above data

600 students of a school use different mode of transport to go to school s below Draw the bar graph representing the above data.

The length of 40 leaves of a plant are measured correct to one millimetre, and the obtained data is represented in the following table. : Draw a histogram to represent the given data.

MBD-STATISTICS-EXERCISE
  1. For the following data, draw a frequency polygon .

    Text Solution

    |

  2. In a city, the following weekly observations were made in a study on c...

    Text Solution

    |

  3. The following table gives the distribution of IQ (intelligence Quotien...

    Text Solution

    |

  4. A teacher wanted to analyse the performance of two sections of student...

    Text Solution

    |

  5. The mean of 96, 98, x, 102, 104 is 100, find x.

    Text Solution

    |

  6. Find the mean of all possible factors of 20.

    Text Solution

    |

  7. Find the mean of 25, 27, 19, 29, 21, 23, 25, 30, 28, 20 and prove that...

    Text Solution

    |

  8. Let m be the mid-point and l be the upper class limit of a class in a ...

    Text Solution

    |

  9. The class marks of a frequency distribution are given as follows : 15,...

    Text Solution

    |

  10. In the class intervals 10-20, 20-30, the number 20 is included in.

    Text Solution

    |

  11. A grouped frequency table with class intervals of equal sizes using 25...

    Text Solution

    |

  12. A grouped frequency distribution table with classes of equal sizes usi...

    Text Solution

    |

  13. To draw a histogram to represent the following frequency ditribution :...

    Text Solution

    |

  14. The mean of five numbers is 30. If one number is excluded, their mean ...

    Text Solution

    |

  15. If the mean of the observations : x, x + 3, x + 5, x + 7, x + 10 is 9,...

    Text Solution

    |

  16. If barx represents the mean of n observations x1, x2,…….,xn , then val...

    Text Solution

    |

  17. If each observation of the data is increased by 5, then their mean

    Text Solution

    |

  18. Let barx be the mean of x1,x2,……,xn and bary the mean of y1,y2……,yn ba...

    Text Solution

    |

  19. If barx is the mean of x1,x2,x3, ………..xn , then for ane0, the mean of ...

    Text Solution

    |

  20. If barx1,barx2,barx3,….., barxn are the means of n groups with n1,n2,…...

    Text Solution

    |