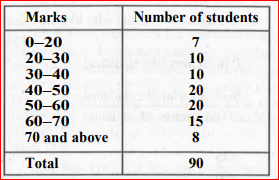
 : Find the probability that a student obtained 60 or above


Topper's Solved these Questions
Similar Questions
Explore conceptually related problems
MBD-PROBABILITY-EXERCISE
- A teacher analyses the performance of two sections of students in a ma...
Text Solution
|
- A coin is tossed 1000 times with the following frequencies of head and...
Text Solution
|
- Two coins are tossed 500 times and we get Two heads : 105 One head : ...
Text Solution
|
- From a telephone directory, 200 telephone numbers are chosen and frequ...
Text Solution
|
- A large tyre manufacturing company kept a record of the distance at wh...
Text Solution
|
- A large tyre manufacturing company kept a record of the distance at wh...
Text Solution
|
- A large tyre manufacturing company kept a record of the distance at wh...
Text Solution
|
- The percentage of marks obtained by a student in the monthly unit test...
Text Solution
|
- In 100 attempts different coloured regions were striked in given numbe...
Text Solution
|
- In 100 attempts different coloured regions were striked in given numbe...
Text Solution
|