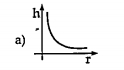
A
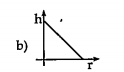
B
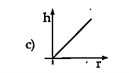
C
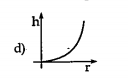
D
Text Solution
Verified by Experts


Similar Questions
Explore conceptually related problems
Recommended Questions
- Which of the following graphs represents the relation between capillar...
Text Solution
|
- Which of the following graphs may represent the relation between the c...
Text Solution
|
- Which of following correctly represents the relation between capillary...
Text Solution
|
- Which of the foolowing correctly represents the relation between capil...
Text Solution
|
- A capillary tube of radius r is immersed in water and water rises in t...
Text Solution
|
- The nature of r-h graph ( r is radius of capillary tube and h is capil...
Text Solution
|
- Which of the following graphs may represent the relation between capil...
Text Solution
|
- A capillary tube is dipped in water and the water rises in it to a hei...
Text Solution
|
- The correct graph showing the relation between the height of water col...
Text Solution
|