Home
Class 11
BIOLOGY
What does the graph indicate ? The gr...

What does the graph indicate ?
The graph given below shows the effect of substrate concentration on the rate of reaction of the enzyme green- gram-phos-phatase.

A

The rate of enzyme reaction is directly proprotional to the substrate concentration.

B

Presence of an enzyme inhibitor in the reaction mixture

C

Formation of an enzyme-substrate complex

D

At higher substrate concentration the ph increase

Text Solution

Verified by Experts

The correct Answer is:
B
Promotional Banner

Topper's Solved these Questions

  • ANIMAL TISSUES

    TRUEMAN BIOLOGY|Exercise MULTIPLE CHOICE QUESTIONS|193 Videos
  • CELL- THE BASIC UNIT OF LIFE ( CELL AND ITS STRUCTURAL ORGANISATION )

    TRUEMAN BIOLOGY|Exercise MULTIPLE CHOICE ANSWER TYPE|312 Videos

Similar Questions

Explore conceptually related problems

The figure given below shows three velocity -substrate concentration curves for an enzyme reaction. What do the curves a,b and c depit respectively ?

plot a graph of reaction -rate vs concentration of the reactant for a fist order reaction.

What will be the nature of the graph showing the concentration of the reactant and time of a first order reaction ?

A reaction follows the given concentration-time graph The rate for this reaction at 20 s will be

Study the pedigree chart given below what does it show?

What does the sign of DeltaG of a reaction at a given pressure annd temperature indicate about the feasibility of the reaction?

The given graph is showing the relationship between the rate of enzyme reaction and concentration of substrate. At concentration of substrate greater than X, the

When does the graph showing variation of the volume of a given mass of gas with pressure at a constant temperature become linear?

What is slope of the graph of log[A] vs t for a first order reaction, where [A] is the concentration of reactant at any time t during the reaction.

TRUEMAN BIOLOGY-BIOMOLECULES -MULTIPLE CHOICE QUESTIONS
  1. Select out the correct sequence according to increase in complexity...

    Text Solution

    |

  2. If the rate of a reaction is given as K[A] [B], where[A] and [B] ar...

    Text Solution

    |

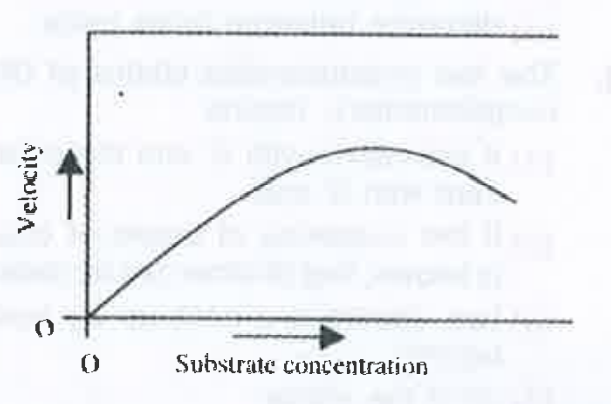
  3. What does the graph indicate ? The graph given below shows the eff...

    Text Solution

    |

  4. The bonds between the enzyme and substrate must be

    Text Solution

    |

  5. Consider the following statements 1. Linolenic 2.Epimers 3. ...

    Text Solution

    |

  6. Consider the following statement. D-glucose, D-galactose and D-fruc...

    Text Solution

    |

  7. Which one of the following statements is not correct?

    Text Solution

    |

  8. The same enzyme catalyzed reaction showed two different kinetic pat...

    Text Solution

    |

  9. Listed below are certain proteins. Which of them are the only stru...

    Text Solution

    |

  10. Which of the following amino acids have side chain that are negative...

    Text Solution

    |

  11. When the following amino acids are separated by running them on Agr...

    Text Solution

    |

  12. Atherogenic lipoproteins are all EXCEPT

    Text Solution

    |

  13. An enzyme that stimulates germination of barley seeds is

    Text Solution

    |

  14. An organic substance bound to an enzyme and essential for its activ...

    Text Solution

    |

  15. The figure given below shows three velocity -substrate concentratio...

    Text Solution

    |

  16. Purines are generally abbreviated as

    Text Solution

    |

  17. Quaternary structure is present in

    Text Solution

    |

  18. Inulin is a polymer of

    Text Solution

    |

  19. Three of the following statements about enzymes are correct and one is...

    Text Solution

    |

  20. The figure given below shows the conversion of a substrate into pro...

    Text Solution

    |