Home
Class 12
BIOLOGY
The following graph depicts changes in t...

The following graph depicts changes in two populations (A and B) of herbivores in a grassy field. A possible reason for these changes is that

A

Population B competed more successfully for food than population A

B

Population A produced more offspring than population B

C

Population A consumed the members of population B

D

Both plant populations in this habitat decreased.

Text Solution

Verified by Experts

The correct Answer is:
A
Promotional Banner

Topper's Solved these Questions

  • NEURAL CONTROL AND COORDINATION

    TRUEMAN BIOLOGY|Exercise MCQ|247 Videos
  • PLANT GROWTH AND DEVELOPMENT AND PLANT MOVEMENTS

    TRUEMAN BIOLOGY|Exercise MULTIPLE CHOICE QUESTIONS|161 Videos

Similar Questions

Explore conceptually related problems

Which of the following is chemical change___

The given graph indicates the change in concentrations of A and B of a reversible reaction, A hArr nB at constant temperature. If the value of equilibrium constant of the reaction is 1.2 at that temperature, then find the value of n.

Which of the following is physical change_____

The following change is observed due to addition of hops is bear wart during fermentation

why does the frequency of an allele in a population changes?

A system undergoes the process: A to B to C to D . In this process, the change in a state function (X) of the system is x. in the steps A to B and B to C of the process, if the changes in X are y and z respectively, then the change in X in step D to C is-

Which of the following does not change during compression of a gas at constant pressure-

Which one of the following has not changed for the last several thousand years

Write the reagents required for the following changes

Write the reagents required for the following changes

TRUEMAN BIOLOGY-ORGANISMS AND POPULASTIONS -Multiple Choice Questions
  1. Adapative measure to protect against extreme heat by poikilotherms is

    Text Solution

    |

  2. A sedentary sea anemone gets attached to the shell lining of hermit cr...

    Text Solution

    |

  3. A biologist studied the population of rats in a barn. He found that th...

    Text Solution

    |

  4. Just as a person moving from Delhi to Shimla to escape the heat for th...

    Text Solution

    |

  5. A location with luxuriant growth of lichens on the trees indicates tha...

    Text Solution

    |

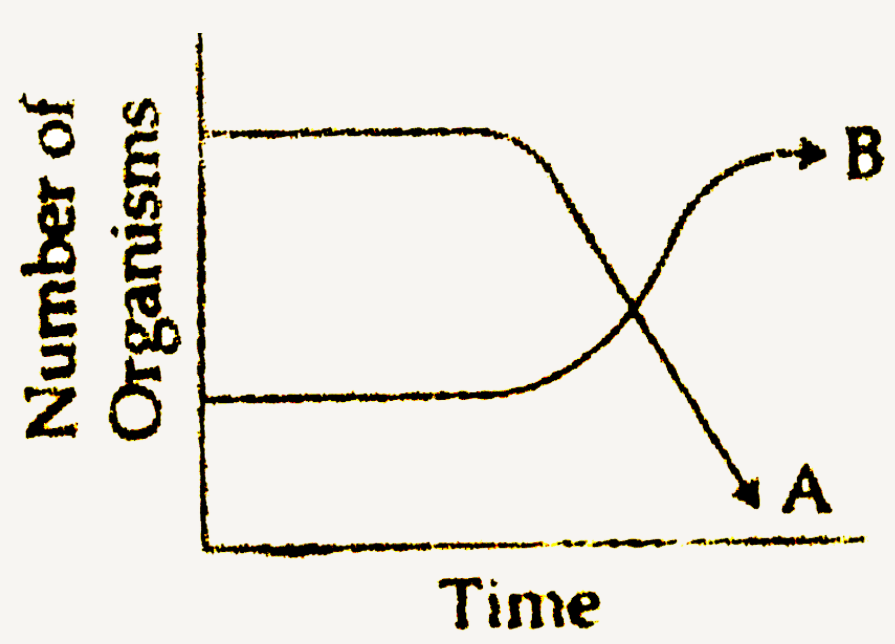
  6. The following graph depicts changes in two populations (A and B) of he...

    Text Solution

    |

  7. An association of individuals of different species living in the same ...

    Text Solution

    |

  8. Most animals that live in deep oceanic waters are:

    Text Solution

    |

  9. In which of the following interaction both partners are adversely affe...

    Text Solution

    |

  10. Gause's principle of competitive exclusion states that:

    Text Solution

    |

  11. When does the growth rate of a population following the logistic model...

    Text Solution

    |

  12. Which of the following is correct for r-selected species ?

    Text Solution

    |

  13. If '+' sign is assigned to benefited interaction '-' sign to detriment...

    Text Solution

    |

  14. The principle of competitive exclusion was stated by

    Text Solution

    |

  15. Asymptote in a logistic growth curve is obtained, when

    Text Solution

    |

  16. Plants, which produce characteristic pneumatophores and show vivpary...

    Text Solution

    |

  17. Which one fo the following population interactions is widely used in m...

    Text Solution

    |

  18. In a growing population of a country ,

    Text Solution

    |

  19. Which one of the following plants shows a very close relationship with...

    Text Solution

    |

  20. Natality refers to

    Text Solution

    |