A
B
C
D
Text Solution
Verified by Experts
The correct Answer is:


Topper's Solved these Questions
NCERT EXEMPLAR-MOTION AND TIME-LONG ANSWER QUESTIONS
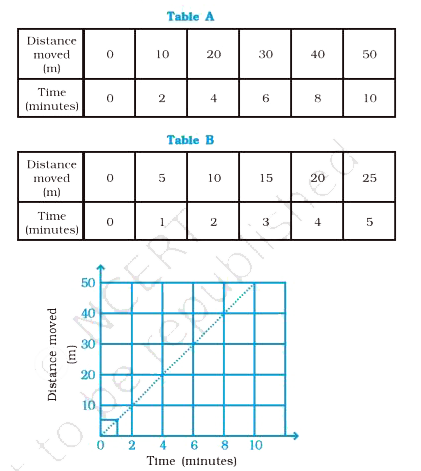
- Two students were asked to plot a distance-time graph for the motion d...
Text Solution
|
- Given below as Figure 13.8 is the distance-time graph of the motion an...
Text Solution
|
- Distance between Bholu’s and Golu’s house is 9 km. Bholu has to attend...
Text Solution
|
- Boojho goes to the football ground to play football. The distance- tim...
Text Solution
|