Text Solution
Verified by Experts


NCERT EXEMPLAR-GARBAGE IN , GARBAGE OUT-LONG ANSWER QUESTIONS
- Put a tick (√) against the garbage items given in Table 16.1 which cou...
Text Solution
|
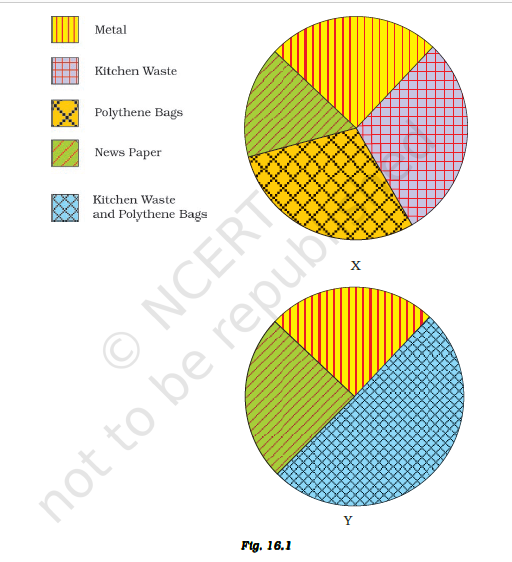
- The pie charts A and B shown in Fig. 16.1 are based on waste segregati...
Text Solution
|
- Given below are steps in vermicomposting and each step has been given ...
Text Solution
|
- Write 3 sentences on what comes to your mind when you chance to see th...
Text Solution
|
- Beautiful hand crafted articles like boxes and toys are made of paper ...
Text Solution
|
- Recently, a ban on plastic bags has been imposed in many places? Is th...
Text Solution
|
- Why should we not burn plastic items?
Text Solution
|
- What happens when Cooking medium is made to flow down a drain.
Text Solution
|
- What happens when Insecticides, motor oil, paints are poured down th...
Text Solution
|
- What happens when Tea leaves, cotton swabs and old soft toys are thr...
Text Solution
|
- Answer the following questions in one or two words or sentences: Why ...
Text Solution
|
- Answer the following questions in one or two words or sentences: Who...
Text Solution
|
- Answer the following questions in one or two words or sentences: Whic...
Text Solution
|