


Topper's Solved these Questions
NCERT EXEMPLAR-DATA HANDLING-EXERCISE
- Application on problem solving strategy Given below is a pie chart d...
Text Solution
|
- Given below is a frequency distribution table. Read it and answer the ...
Text Solution
|
- Given below is a frequency distribution table. Read it and answer the ...
Text Solution
|
- Given below is a frequency distribution table. Read it and answer the ...
Text Solution
|
- Given below is a frequency distribution table. Read it and answer the ...
Text Solution
|
- Given below is a frequency distribution table. Read it and answer the ...
Text Solution
|
- Given below is a frequency distribution table. Read it and answer the ...
Text Solution
|
- The top speeds of 30 different land animals have been organised into a...
Text Solution
|
- Given below is a pie chart showing the time spend by a group of 350 ch...
Text Solution
|
- Given below is a pie chart showing the time spend by a group of 350 ch...
Text Solution
|
- Given below is a pie chart showing the time spend by a group of 350 ch...
Text Solution
|
- Given below is a pie chart showing the time spend by a group of 350 ch...
Text Solution
|
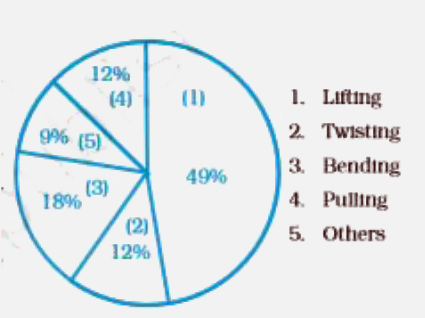
- The pie chart on the right shows the result of a survey carried out to...
Text Solution
|
- The pie chart on the right shows the result of a survey carried out to...
Text Solution
|
- The pie chart on the right shows the result of a survey carried out to...
Text Solution
|
- The pie chart on the right shows the result of a survey carried out to...
Text Solution
|
- The pie chart on the right shows the result of a survey carried out to...
Text Solution
|
- 4 A dice is thrown once, then the probability of getting an odd prime ...
Text Solution
|
- A dice is rolled once. What is the probability that the number on top ...
Text Solution
|
- In a throw of a dice, find the probability of: (i) getting a multipl...
Text Solution
|
- A dice is rolled once. What is the probability that the number on top ...
Text Solution
|