A
B
C
D
Text Solution
Verified by Experts


Topper's Solved these Questions
DATA HANDLING
NCERT EXEMPLAR|Exercise EXERCISE (Fill in the blanks )|23 VideosDATA HANDLING
NCERT EXEMPLAR|Exercise EXERCISE (True or False)|23 VideosDATA HANDLING
NCERT EXEMPLAR|Exercise THINK AND DISCUSS |2 VideosCOMPARING QUANTITIES
NCERT EXEMPLAR|Exercise Think and Discuss|2 VideosDIRECT AND INVERSE PROPORTIONS
NCERT EXEMPLAR|Exercise THINK AND DISCUSS|2 Videos
NCERT EXEMPLAR-DATA HANDLING-EXERCISE (Choose the correct answer )
- Observe the pie chart given below and answer questions based on it. ...
Text Solution
|
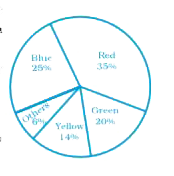
- Students of a class voted for their favourite colour. If 400 students ...
Text Solution
|
- Students of a class voted for their favourite colour and a pie chart w...
Text Solution
|
- Listed below are the temperature in ""^@C for 10 days. -6, -8,0, 3, ...
Text Solution
|
- There are 4 blue, 7 red, 3 black and 6 white balls on a table. A cat j...
Text Solution
|
- Rahul wins if spinner lands on red. Varun wins if spinner lands on blu...
Text Solution
|
- In a frequency distribution with classes 0-10, 10-20 etc., the size of...
Text Solution
|
- A coin is tossed 200 times and head appeared 120 times. The probabilit...
Text Solution
|
- Data collected in a survey shows that 40% of the buyers are interested...
Text Solution
|
- Monthly salary of a person is Rs. 15000. Then the amount he spends on ...
Text Solution
|
- The central angle of the sector showing the distribution of protein an...
Text Solution
|
- Rohan and Shalu are playing with 5 cards as shown in the figure. What ...
Text Solution
|
- What is the ratio of the distribution of proteins in the muscles to...
Text Solution
|
- What is the central angle of the sector in the pie chart representing ...
Text Solution
|
- What is the central angle of the sector in the pie chart representing...
Text Solution
|
- A coin is tossed 12 times and results in 7 tails. Then chance of occur...
Text Solution
|
- Total number of outcomes, when a ball is drawn from a bag which contai...
Text Solution
|
- A graph showing two sets of data simultaneously is known as
Text Solution
|
- Size of the class 150-175 is
Text Solution
|
- In a throw of a dice, the probability of getting the number 7 is
Text Solution
|