


NCERT EXEMPLAR-DATA HANDLING-EXERCISE
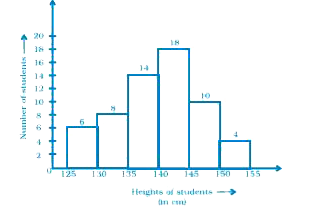
- Look at the histogram below and answer the questions that follow. ...
Text Solution
|
- Look at the histogram below and answer the questions that follow. ...
Text Solution
|
- Look at the histogram below and answer the questions that follow. ...
Text Solution
|
- Following are the number of members in 25 families of a village: 6, ...
Text Solution
|
- The marks obtained (out of 20) by 30 students of a class in a test are...
Text Solution
|
- The weights (in kg) of 30 students of a class are 39,43,32,37,29,26,...
Text Solution
|
- The weights (in kg) of 30 students of a class are 39,43,32,37,29,26,...
Text Solution
|
- Shoes of the following brands are sold in Nov. 2007 at a shoe store. C...
Text Solution
|
- The following pie chart depicts the expenditure of a state government ...
Text Solution
|
- The following pie chart depicts the expenditure of a state government ...
Text Solution
|
- The following pie chart depicts the expenditure of a state government ...
Text Solution
|
- The following data represents the different number of animals in a zoo...
Text Solution
|
- Playing cards (a) From a pack of cards the following cards are kept ...
Text Solution
|
- Now the following cards are added to the above cards: What is the...
Text Solution
|
- Construct a frequency table for the following weights (in gm) of 35...
Text Solution
|
- Construct a frequency table for the following weights (in gm) of 35...
Text Solution
|
- Complete the following table: Find the total number of persons wh...
Text Solution
|
- Draw a histogram for the following data.
Text Solution
|
- In a hypothetical sample of 20 people the amounts of money with the...
Text Solution
|
- The histogram given below shows the number of literate females iin the...
Text Solution
|