


NCERT EXEMPLAR-DATA HANDLING-EXERCISE
- The following pie chart depicts the expenditure of a state government ...
Text Solution
|
- The following pie chart depicts the expenditure of a state government ...
Text Solution
|
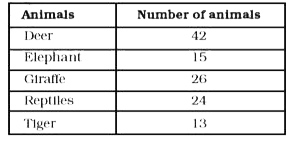
- The following data represents the different number of animals in a zoo...
Text Solution
|
- Playing cards (a) From a pack of cards the following cards are kept ...
Text Solution
|
- Now the following cards are added to the above cards: What is the...
Text Solution
|
- Construct a frequency table for the following weights (in gm) of 35...
Text Solution
|
- Construct a frequency table for the following weights (in gm) of 35...
Text Solution
|
- Complete the following table: Find the total number of persons wh...
Text Solution
|
- Draw a histogram for the following data.
Text Solution
|
- In a hypothetical sample of 20 people the amounts of money with the...
Text Solution
|
- The histogram given below shows the number of literate females iin the...
Text Solution
|
- The below histogram shows the number of literate females in the age gr...
Text Solution
|
- The below histogram shows the number of literate females in the age gr...
Text Solution
|
- The below histogram shows the number of literate females in the age gr...
Text Solution
|
- The following histogram shows the frequency distribution of teaching e...
Text Solution
|
- The following histogram shows the frequency distribution of teaching e...
Text Solution
|
- The following histogram shows the frequency distribution of teaching e...
Text Solution
|
- In a district, the number of branches of different banks is given belo...
Text Solution
|
- For the development of basic infrastructure in a district, a project o...
Text Solution
|
- In the time table of a school, periods allotted per week to different ...
Text Solution
|