


Topper's Solved these Questions
Similar Questions
Explore conceptually related problems
NCERT EXEMPLAR-DATA HANDLING-EXERCISE
- The below histogram shows the number of literate females in the age gr...
Text Solution
|
- The below histogram shows the number of literate females in the age gr...
Text Solution
|
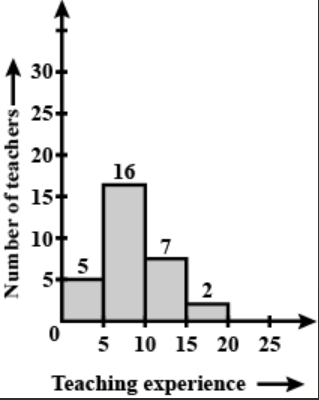
- The following histogram shows the frequency distribution of teaching e...
Text Solution
|
- The following histogram shows the frequency distribution of teaching e...
Text Solution
|
- The following histogram shows the frequency distribution of teaching e...
Text Solution
|
- In a district, the number of branches of different banks is given belo...
Text Solution
|
- For the development of basic infrastructure in a district, a project o...
Text Solution
|
- In the time table of a school, periods allotted per week to different ...
Text Solution
|
- A survey was carried out to find the favourite beverage preferred by a...
Text Solution
|
- A survey was carried out to find the favorite beverage preferred by a ...
Text Solution
|
- The following data represents the approximate percentage of water in v...
Text Solution
|
- At a Birthday Party, the children spin a wheel to get a gift. Find the...
Text Solution
|
- At a Birthday Party, the children spin a wheel to get a gift. Find the...
Text Solution
|
- At a Birthday Party, the children spin a wheel to get a gift. Find the...
Text Solution
|
- Sonia picks up a card from the given cards. Calculate the probabi...
Text Solution
|
- Sonia picks up a card from the given cards. Calculate the probabi...
Text Solution
|
- Sonia picks up a card from the given cards. Calculate the probabili...
Text Solution
|
- Sonia picks up a card from the given cards. Calculate the probabi...
Text Solution
|
- Identify which symbol should appear in each sector in 113, 114.
Text Solution
|
Text Solution
|