


Topper's Solved these Questions
NCERT EXEMPLAR-INTRODUCTION TO GRAPHS -EXERCISE
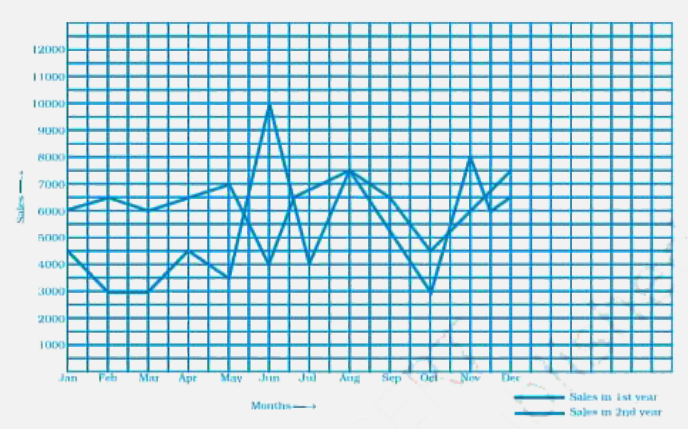
- Following graph shows a comparison of the approximate sale of items ma...
Text Solution
|
- Comparison of parts of a whole may be done by a
Text Solution
|
- A graph that displays data that changes continuously over periods of t...
Text Solution
|
- In the given graph the coordinates of point x are
Text Solution
|
- In the given graph the letter that indicates the point (0, 3) is
Text Solution
|
- The point (3, 4) is at a distance of
Text Solution
|
- A point which lies on both the axis is
Text Solution
|
- The coordinates of a point at a distance of 3 units from the x axis an...
Text Solution
|
- In the given figure the position of the book on the table may be given...
Text Solution
|
- Data was collected on a student’s typing rate and graph was drawn as s...
Text Solution
|
- Which graphs of the following represent the table below?
Text Solution
|
- displays data that changes continuously over periods of time.
Text Solution
|
- The relation between dependent and independent variables is shown thro...
Text Solution
|
- We need coordinates for representing a point on the graph sheet.
Text Solution
|
- A point in which the x-coordinate is zero and y-coordinate is non zero...
Text Solution
|
- The horizontal and vertical line in a line graph are usually called a...
Text Solution
|
- The process of fixing a point with the help of the coordinates is know...
Text Solution
|
- The distance of any point from the y-axis is the coordinate.
Text Solution
|
- All points with y-coordinate as zero lie on the .
Text Solution
|
- For the point (5, 2), the distance from the x-axis is units.
Text Solution
|
- The x-coordinate of any point lying on the y-axis will be .
Text Solution
|