


NCERT EXEMPLAR-INTRODUCTION TO GRAPHS -EXERCISE
- In the given figure the position of the book on the table may be given...
Text Solution
|
- Data was collected on a student’s typing rate and graph was drawn as s...
Text Solution
|
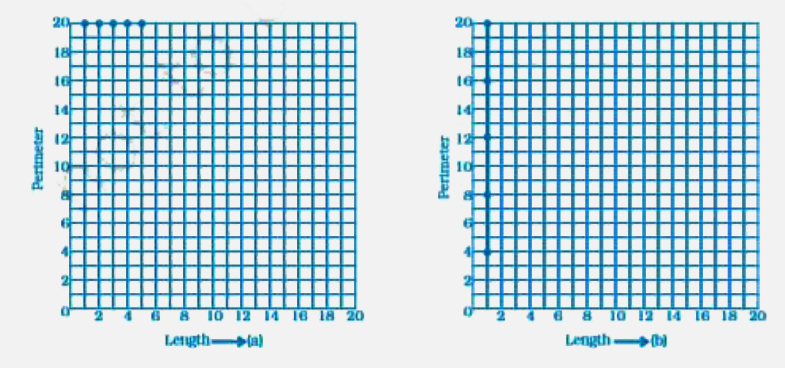
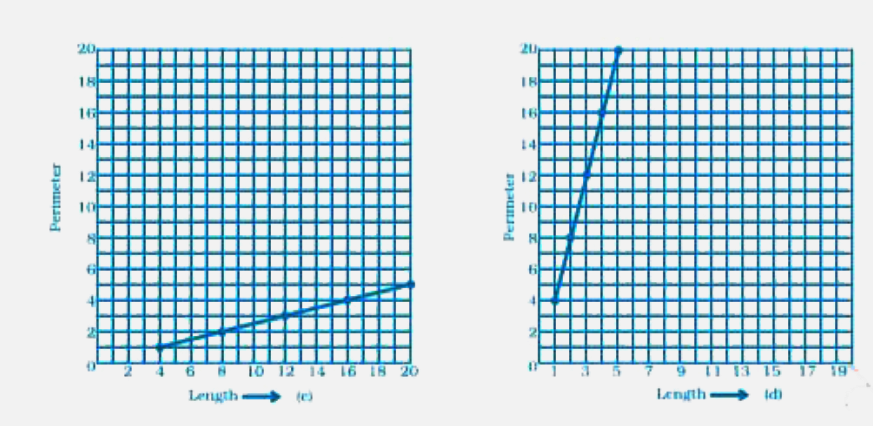
- Which graphs of the following represent the table below?
Text Solution
|
- displays data that changes continuously over periods of time.
Text Solution
|
- The relation between dependent and independent variables is shown thro...
Text Solution
|
- We need coordinates for representing a point on the graph sheet.
Text Solution
|
- A point in which the x-coordinate is zero and y-coordinate is non zero...
Text Solution
|
- The horizontal and vertical line in a line graph are usually called a...
Text Solution
|
- The process of fixing a point with the help of the coordinates is know...
Text Solution
|
- The distance of any point from the y-axis is the coordinate.
Text Solution
|
- All points with y-coordinate as zero lie on the .
Text Solution
|
- For the point (5, 2), the distance from the x-axis is units.
Text Solution
|
- The x-coordinate of any point lying on the y-axis will be .
Text Solution
|
- The y-coordinate of the point (2, 4) is .
Text Solution
|
- In the point (4, 7), 4 denotes the .
Text Solution
|
- A point has 5 as its x–coordinate and 4 as its y–coordinate. Then the ...
Text Solution
|
- In the coordinates of a point, the second number denotes the .
Text Solution
|
- The point where the two axes intersect is called the .
Text Solution
|
- For fixing a point on the graph sheet we need two coordinates.
Text Solution
|
- State True or False A line graph can also be a whole unbroken line.
Text Solution
|