


NCERT EXEMPLAR-INTRODUCTION TO GRAPHS -EXERCISE
- The points (3, 5) and (5, 3) represent the same point.
Text Solution
|
- The y-coordinate of any point lying on the x-axis will be zero.
Text Solution
|
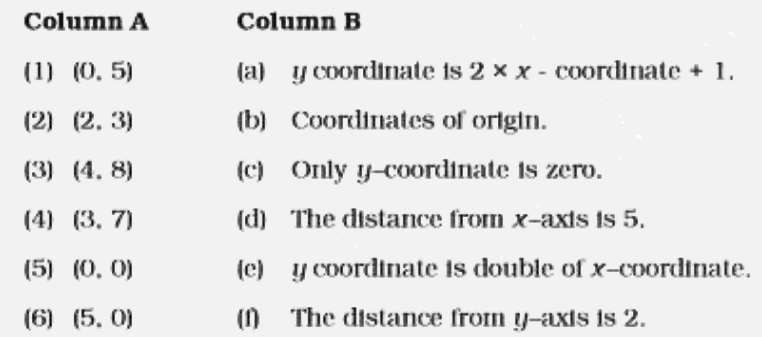
- Match the coordinates given in Column A with the items mentioned in Co...
Text Solution
|
- Match the ordinates of the points given in Column A with the items men...
Text Solution
|
- From the given graph, choose the letters that indicate the location of...
Text Solution
|
- Find the coordinates of all letters in the graph given below.
Text Solution
|
- Plot the given points on a graph sheet. (i) (5,4) (ii) (2,0) (ii...
Text Solution
|
- Study the given map of a zoo and answer the following questions.
Text Solution
|
- Write the x-coordinate (abscissa) of each of the given points. (a) (...
Text Solution
|
- Write the y-coordinate (ordinate) of each of the given points. (a) (...
Text Solution
|
- Plot the given points on a graph sheet and check if the points lie on ...
Text Solution
|
- If y–coordinate is 3 times x-coordinate, form a table for it and draw ...
Text Solution
|
- Make a line graph for the area of a square as per the given table. ...
Text Solution
|
- The cost of a note book is Rs 10. Draw a graph after making a table sh...
Text Solution
|
- Explain the situations represented by the following distance-time grap...
Text Solution
|
- Complete the given tables and draw a graph for each.
Text Solution
|
- Study the given graphs (a) and (b) and complete the corresponding tabl...
Text Solution
|
- Draw a graph for the radius and circumference of circle using a suitab...
Text Solution
|
- The graph shows the maximum temperatures recorded for two consecutive ...
Text Solution
|
- The graph given below gives the actual and expected sales of cars of a...
Text Solution
|