


NCERT EXEMPLAR-INTRODUCTION TO GRAPHS -EXERCISE
- The cost of a note book is Rs 10. Draw a graph after making a table sh...
Text Solution
|
- Explain the situations represented by the following distance-time grap...
Text Solution
|
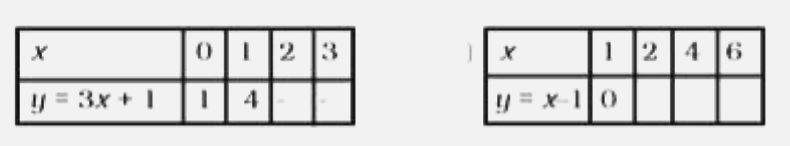
- Complete the given tables and draw a graph for each.
Text Solution
|
- Study the given graphs (a) and (b) and complete the corresponding tabl...
Text Solution
|
- Draw a graph for the radius and circumference of circle using a suitab...
Text Solution
|
- The graph shows the maximum temperatures recorded for two consecutive ...
Text Solution
|
- The graph given below gives the actual and expected sales of cars of a...
Text Solution
|
- The graph given below shows the marks obtained out of 10 by Sonia in t...
Text Solution
|
- Find the coordinates of the vertices of the given figures.
Text Solution
|
- Study the graph given below of a person who started from his home and ...
Text Solution
|
- Plot a line graph for the variables p and q where p is two times q i.e...
Text Solution
|
- Study the graph and answer the questions that follow. (a) What infor...
Text Solution
|
- Study the distance-time graph given below for a car to travel to certa...
Text Solution
|
- Locate the points A (1,2), B (4,2) and C (1,4) on a graph sheet taking...
Text Solution
|
- Locate the points A(1,2), B (3,4) and C (5,2) on a graph sheet taking ...
Text Solution
|
- Locate the points P (3,4), Q (1,0), R (0,4), S (4,1) on a graph sheet.
Text Solution
|
- The graph given below compares the sales of ice creams of two vendors ...
Text Solution
|
- The table given below shows the temperatures recorded on a day at diff...
Text Solution
|
- The following table gives the growth chart of a child. Draw a lin...
Text Solution
|
- The following is the time-distance graph of Sneha’s walking. (a) ...
Text Solution
|