


NCERT EXEMPLAR-INTRODUCTION TO GRAPHS -EXERCISE
- Study the graph given below of a person who started from his home and ...
Text Solution
|
- Plot a line graph for the variables p and q where p is two times q i.e...
Text Solution
|
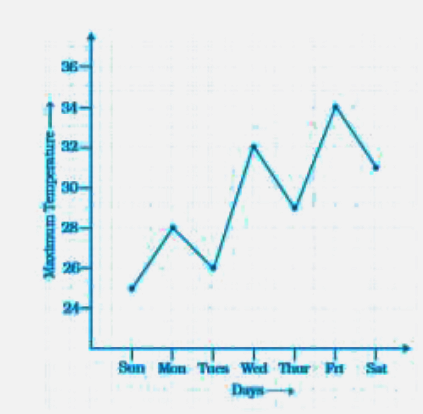
- Study the graph and answer the questions that follow. (a) What infor...
Text Solution
|
- Study the distance-time graph given below for a car to travel to certa...
Text Solution
|
- Locate the points A (1,2), B (4,2) and C (1,4) on a graph sheet taking...
Text Solution
|
- Locate the points A(1,2), B (3,4) and C (5,2) on a graph sheet taking ...
Text Solution
|
- Locate the points P (3,4), Q (1,0), R (0,4), S (4,1) on a graph sheet.
Text Solution
|
- The graph given below compares the sales of ice creams of two vendors ...
Text Solution
|
- The table given below shows the temperatures recorded on a day at diff...
Text Solution
|
- The following table gives the growth chart of a child. Draw a lin...
Text Solution
|
- The following is the time-distance graph of Sneha’s walking. (a) ...
Text Solution
|
- Draw a parallelogram ABCD on a graph paper with the coordinates given ...
Text Solution
|
- Draw the line passing through (2, 3) and (3, 2). Find the coordinat...
Text Solution
|
- The following graph shows the change in temperature of a block of ice ...
Text Solution
|
- The following graph shows the number of people present at a certain sh...
Text Solution
|
- A man started his journey on his car from location A and came back. Th...
Text Solution
|
- The following graph shows the journey made by two cyclists, one from t...
Text Solution
|
- Ajita starts off from home at 07.00 hours with her father on a scooter...
Text Solution
|
- Draw the line graph using suitable scale to show the annual gross prof...
Text Solution
|
- The following chart gives the growth in height in terms of percentage ...
Text Solution
|