Home
Class 6
MATHS
The following table gives information ab...

The following table gives information about the circulation of newspapers (dailies) in a town in five languages.

Prepare a pictograph of the above data, using a symbol of your choice, each representing 1000 newspapers.

Promotional Banner

Topper's Solved these Questions

  • DATA HANDLING

    NCERT EXEMPLAR|Exercise Exercise (fill in the blanks )|8 Videos
  • ALGEBRA

    NCERT EXEMPLAR|Exercise EXERCISE |104 Videos
  • FRACTIONS AND DECIMALS

    NCERT EXEMPLAR|Exercise ACTIVITY|1 Videos

Similar Questions

Explore conceptually related problems

Annual expenditure of a company in the year 2007-2008 is given below: Prepare a pictograph of the above data using an appropriate symbol to represent Rs 10 lakh.

The bar graph given below represents the circulation of newspapers (dailies) in a town in six languages (the figures are approximated to hundreds). f Study the bar graph and answer the following questions: (a) Find the total number of newspapers read in Hindi, Punjabi, Urdu, Marathi and Tamil. (b) Find the excess number of newspapers read in Hindi than those in English. (c) Name the language in which the least number of newspapers are read. (d) Write the total circulation of newspapers in the town.

The number of bottles of cold drinks sold by a shopkeeper on six consecutive days is as follows: Prepare a pictograph of the above data using an appropriate symbol

Total number of animals in five villages are as follows: Village,Number of animals A B C D E ,80120904060 Prepare a pictograph of these animals using one symbol to represent 10 animals.

The following table gives the data of number of schools (stage-wise) of a country in the year 2002. Draw a bar graph to represent the above data:

The bar graph given below represents the circulation of newspapers in different languages in a town. Study the bar graph and answer the following questions: What is the circulation of English newspaper?

The bar graph given below represents the circulation of newspapers in different languages in a town. Study the bar graph and answer the following questions: Name the two languages in which circulation of newspaper is the same.

The following table gives the data on the marks obtained by two students 'A and B' in five subjects : Represent the data by a multiple bar diagram.

The bar graph given below represents the circulation of newspapers in different languages in a town. Study the bar graph and answer the following questions: By how much is the circulation of newspaper in Hindi more than the newspaper in Bengali?

Total number of students of a school in different years is shown in the following table. Prepare another pictograph of students using any other symbol each representing 50 students. Which pictograph do you find more informative ?

NCERT EXEMPLAR-DATA HANDLING-Exercise
  1. The following pictograph depicts the information about the areas in sq...

    Text Solution

    |

  2. The number of bottles of cold drinks sold by a shopkeeper on six conse...

    Text Solution

    |

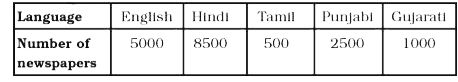
  3. The following table gives information about the circulation of newspap...

    Text Solution

    |

  4. Annual expenditure of a company in the year 2007-2008 is given below: ...

    Text Solution

    |

  5. The following bar graph shows the number of houses (out of 100) in a t...

    Text Solution

    |

  6. The following bar graph shows the number of houses (out of 100) in a t...

    Text Solution

    |

  7. The following bar graph shows the number of houses (out of 100) in a t...

    Text Solution

    |

  8. The following bar graph represents the data for different sizes of sho...

    Text Solution

    |

  9. The following bar graph represents the data for different sizes of sho...

    Text Solution

    |

  10. The following bar graph represents the data for different sizes of sho...

    Text Solution

    |

  11. The following bar graph represents the data for different sizes of sho...

    Text Solution

    |

  12. The following bar graph represents the data for different sizes of sho...

    Text Solution

    |

  13. The following bar graph represents the data for different sizes of sho...

    Text Solution

    |

  14. The following graph gives the information about the number of railway ...

    Text Solution

    |

  15. The following graph gives the information about the number of railway ...

    Text Solution

    |

  16. The following graph gives the information about the number of railway ...

    Text Solution

    |

  17. The following graph gives the information about the number of railway ...

    Text Solution

    |

  18. The following graph gives the information about the number of railway ...

    Text Solution

    |

  19. The bar graph given below represents approximate length (in kilometres...

    Text Solution

    |

  20. The bar graph given below represents approximate length (in kilometres...

    Text Solution

    |